
ilovechoonsik
[STARTERS 4기 TIL] 프로젝트 기반 태블로 실전 트레이닝 #19 - 태블로 자격증 공부 #2 (230406) 본문
[STARTERS 4기 TIL] 프로젝트 기반 태블로 실전 트레이닝 #19 - 태블로 자격증 공부 #2 (230406)
춘시기좋아 2023. 4. 8. 18:28
📖 오늘 내가 배운 것
Tableau Desktop Specialist 공부
1. Tableau Desktop Specialist Test
1. Which of the following are valid objects when creating a dashboard in Tableau? Choose 4.

Text
Extension
Web Page
Image
2. Which of the following are benefits of using Data Extracts in Tableau?
Improved Performance
Faster to work with
3. Our use case states that we need to create a set showing the Bottom 10 products by Profit in each Region. Which of the following filter types should you apply on Region?

1. 먼저 Profit 하위 10개 제품 집합을 만든다.
2. Product를 VLOD로 놓고, 집합 적용하고 지역 차원 필터를 걸어준다
3. 지역 차원 필터로 지역을 변경해도 작업 우선 순위가 Sets 우선이기에 지역이 아닌 전체에서 하위 10개를 뽑아온다.
4. 지역 필터를 Context Filter로 만들고 우선 순위 올려주면 해결
답 : Context Filter
4. If you decide you want to see all of the marks in the view at the most detailed level of granularity, you can __________________ the view.
View에 측정값을 추가하면 태블로는 측정값을 context에 따른 집계된 형태로 보여준다! 세부적인 수준으로 보고 싶다면?
답 : disaggregate the measures
5. True or False: It is not possible to blend axes for multiple measures into a single axis?
답 : False
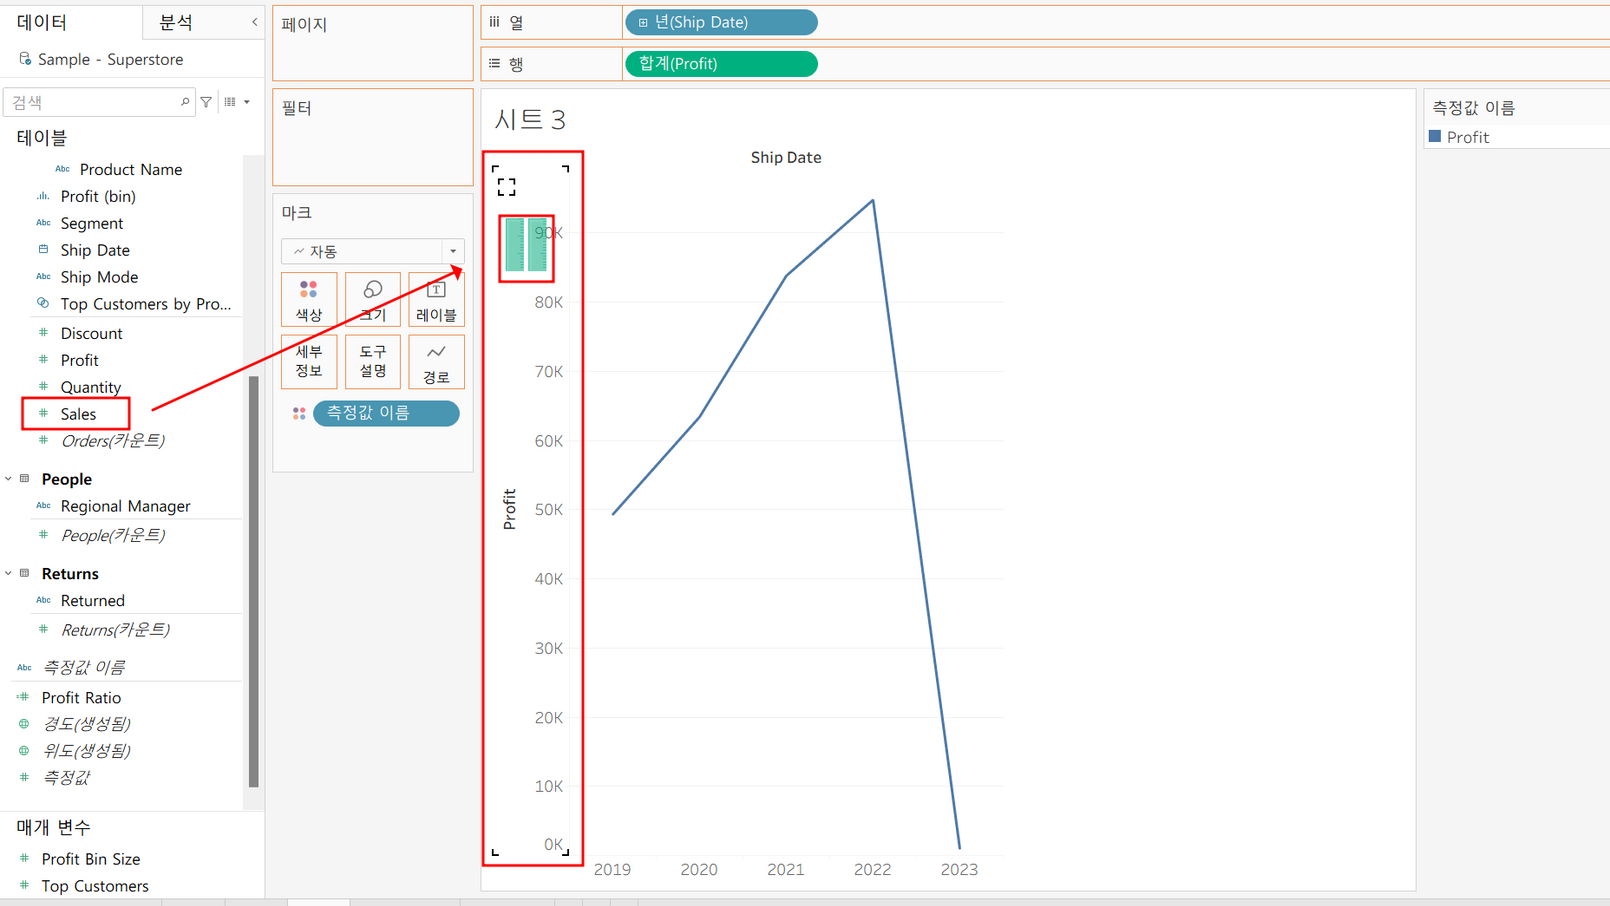
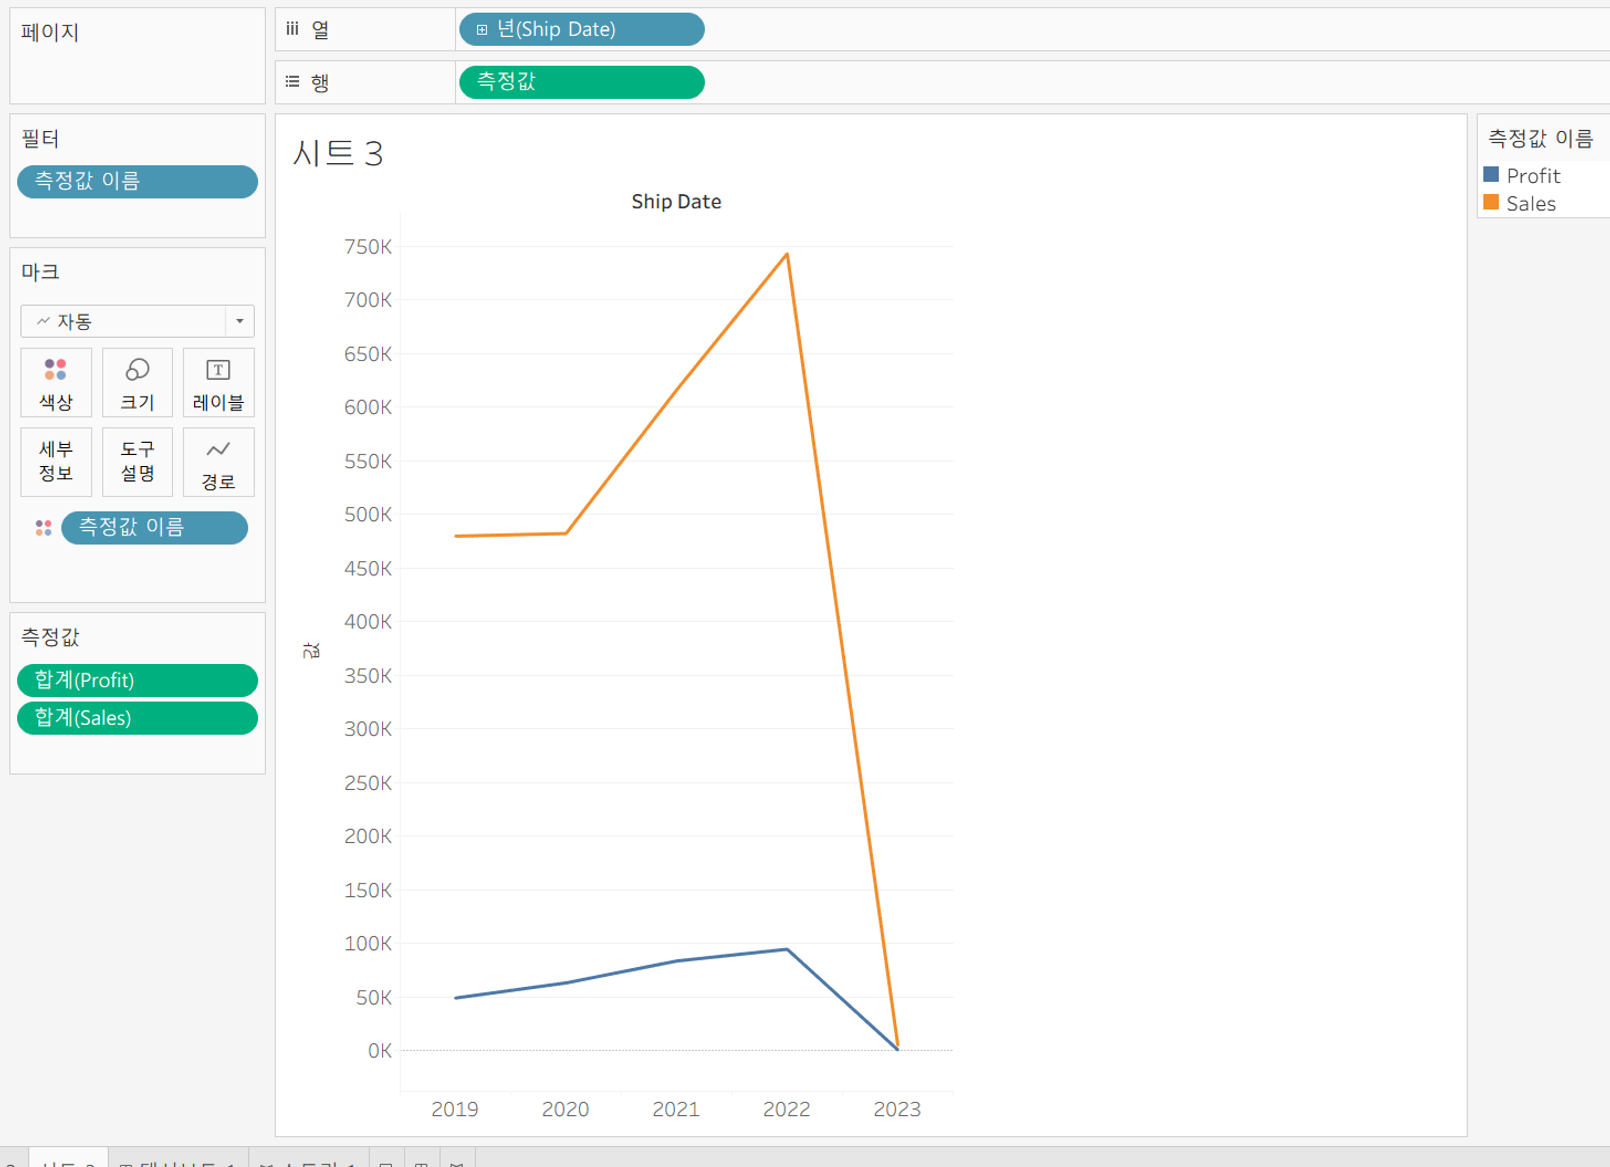
두 개의 측정값을 한 개의 축으로 보여주는 게 가능! 이러한 차트를 Combined-Axis / Blended-Axis 차트
쉽게 이해하면 이중축 가능하냐!
6. If you use a percent difference Quick Table Calculation, what value will be the first data value?
답 : NULL
퀵 테이블의 비율 차이 같은 경우에는 이전 값과 비교하여 현재 값 -+차이 %를 반환해주는데
첫 번째 값은 이전 값이 존재하지 않으므로 NULL이 되어버린다.


7. True or False : Bins can be created on dimensions
답 : TRUE
차원에서 구간 차원을 만들 수 있다! 근데 bins는 수치 값의 분포, 모든 차원에 대해 만들 수 있는 건 아니고 수치값으로 이뤄진 차원이여야 한다!
8. Tableau auto-generates ____________ dimension(s) and _____________ measure(s) for us
1차원 - 측정값 이름
4측정 - 레코드 수, 측정 값, 위도, 경도
9. Which of the following are compelling reasons to use a Stacked Bar Chart?
To be able to visualize complex information with fewer bars / marks
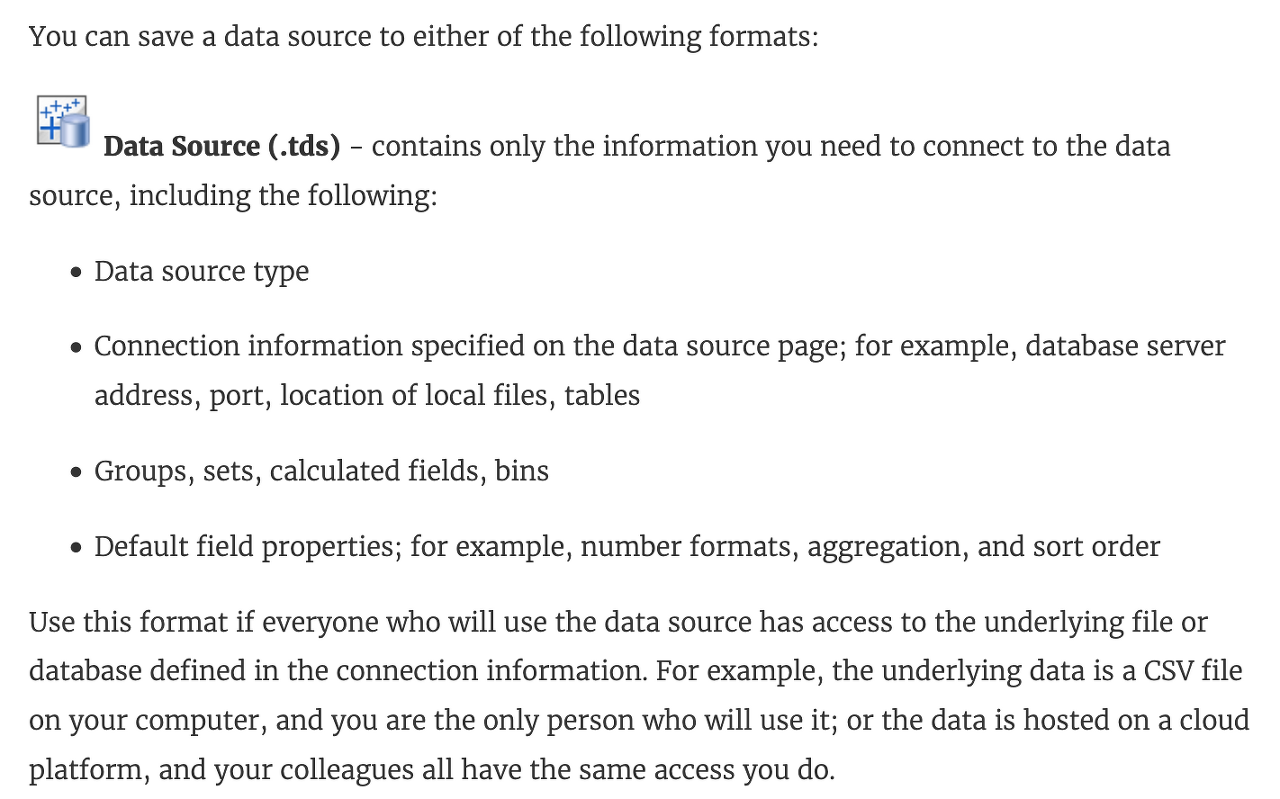
10. Which of the following are stored in a .tds file? Choose 3.
답 :
Data Connection information
tds는 : 계산된 필드, 필드 변경 사항 등이 저장
시각화, 데이터 소스는 따라오지 않는다!
데이터 소스가 함께 오는 건 tdsx
11. True or False: Trend lines can only be used with numeric or date fields
답 : True - 추세선은 두 축 모두 숫자로 해석할 수 있는 필드여야 한다!
12. True or False: All rows from both tables are returned in an INNER JOIN
답 : False
INNER JOIN 시 각 테이블의 모든 행이 반환된다?
→ 당연히 False, key column의 일치하지 않는 각 행 데이터는 반환 되지 않는다
13. _______________ enables us to create workbooks and views, dashboards, and data sources in Tableau Desktop, and then publish this content to our own server.
답 : Tableau Server
태블로 서버를 사용하면 자체적인 서버에 태블로로 만든 것들을 게시할 수 있다! 각 사용자에 대한 권한도 설정 가능!
14. We can join a maximum of ______ tables in Tableau
답 : 32개 테이블
15. Which of the following would you use to connect to multiple tables in a single data source at once?
답 : A Join
16. Which of the following is true about 'Incremental refresh' when creating Extracts in Tableau?

17. ______________ refers to the level of detail for a piece of data, wherever you are looking.
데이터 세분화 되는 단계가 LOD
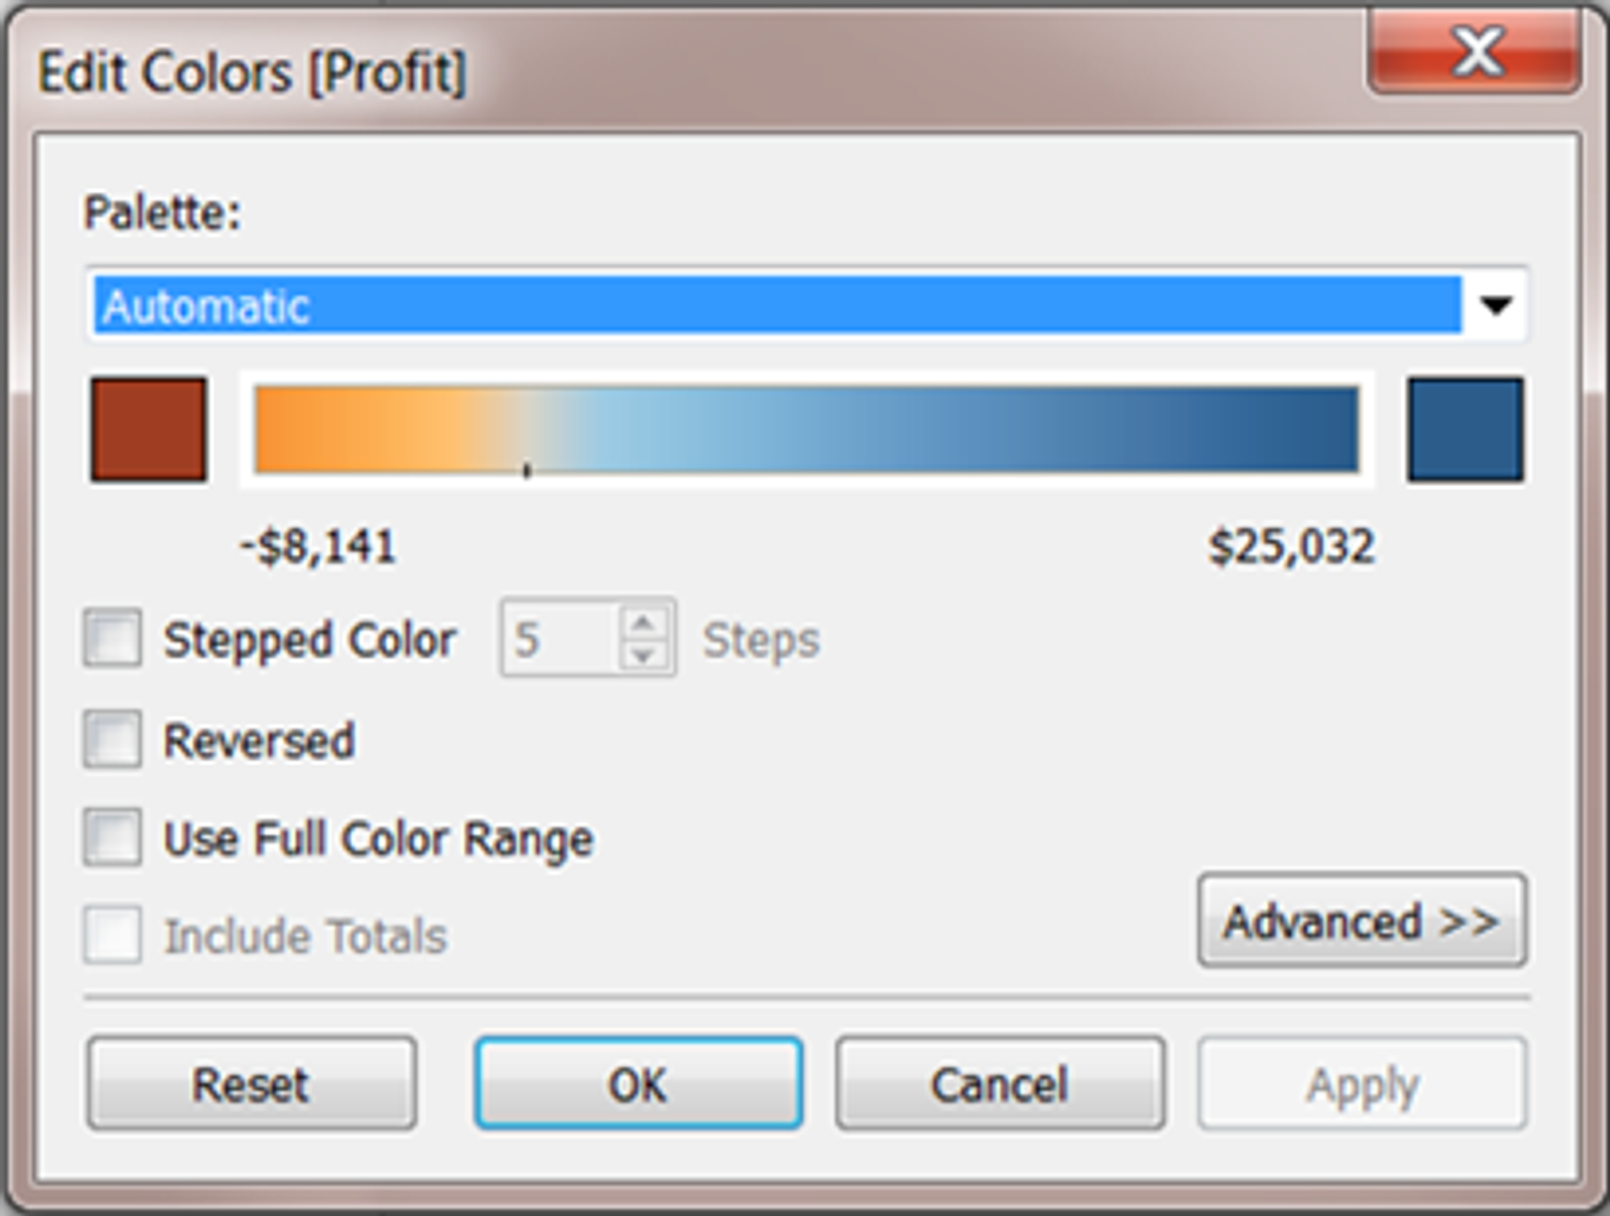
18. When you drop a continuous field on Color, Tableau displays a quantitative legend with a ___________ range of colors.
답 : Continuous
19. You just added SUM(Profit) to the Columns shelf. What will this create?
답 : A horizontal axis
측정값을 Column에 놓으면 - 가로 축
측정값을 Row에 놓으면 - 세로 축
20. True or False: The Highlighting action can be disabled for the entire workbook.
답 : True
통합 문서에 대해 disable 가능!
21. By default, measures placed in a view are aggregated. The type of aggregation applied ______________
기본적으로 보기에 배치된 측정값은 집계, 대부분 SUM이지만 항상 그런 건 아님! 적용되는 집계 유형은 보기의 컨텍스트에 따라 다르다
22. When you want to first apply a filter and THEN show the Top N or Bottom N elements, which of the following filters would you use?
1-Improve performance - 속도 향상
23. You have cleaned a data source properly, created some calculated fields and renamed some columns. You want to save these changes for future use cases. Which of the following would BEST satisfy this requirement?
답 : Save it as a .tds file
데이터 원본 적절히 정리, 계산된 필드 + 컬럼 이름 변경 사항을 저장하고 공유하고 싶다! 적절한 저장 형식은?
24. What is the one critical difference between normal calculated fields, and the calculated fields created after Data blending?
Fields used in Blends must first be aggregated
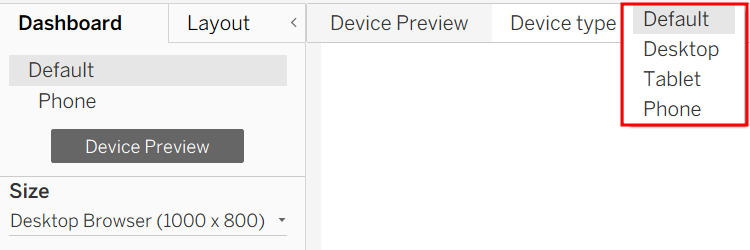
25. When creating a dashboard for multiple devices, which of the following Device options are available in the Device Preview section?
답 : Default, Phone, Tablet, Desktop 그냥 외우기
Which of the following is NOT a valid official data source in Tableau Desktop?
답 : Google Firebase
26. _________________ are a local copy of a subset or entire data set that you can use to share data with others, when you need to work offline, and improve performance.
답 : .tde files
tde (업그레이드 된 게 hyper) - 추출 형식
27. According to Tableau's 'Order of Operations', which of the following filters is applied FIRST
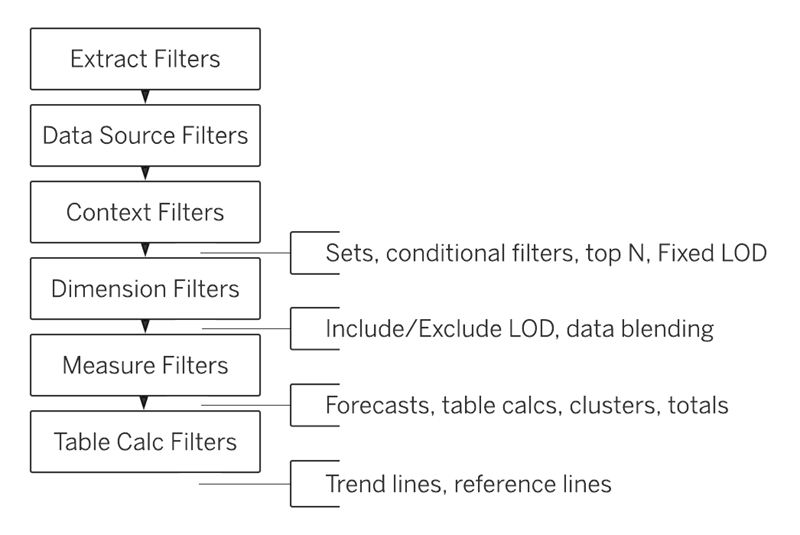
답 : Extract Filter
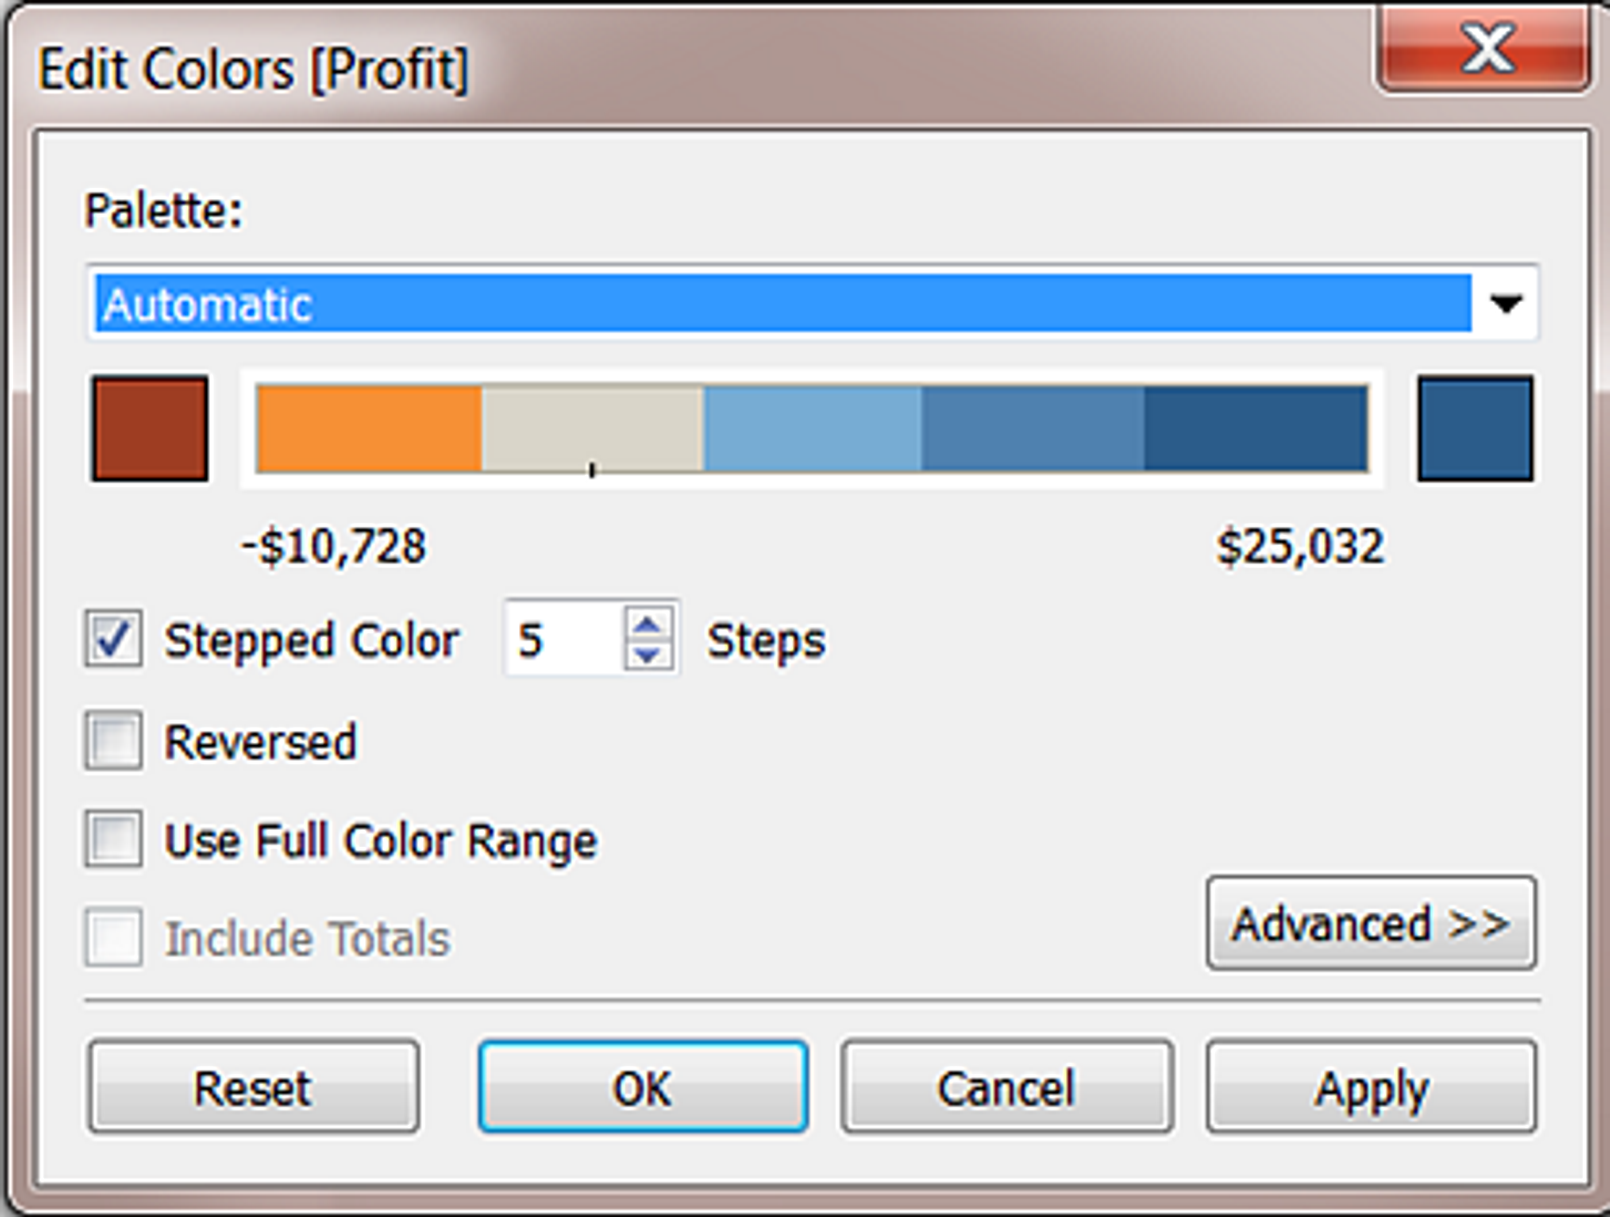
28. You have just created a histogram and now want to be able to change the size of bins dynamically. Using which of the following will easily satisfy your requirement?
답 : Parameters
29. Broadly speaking, when users connect to Tableau, the data fields in their data set are automatically assigned a ____________ and a ____________.
답 : type, role 외우기
30. When exporting a worksheet as an image in Tableau, which of the following file formats are available?
답 :
Portable Network Graphic (.PNG)
JPEG Image (.JPG, .JPEG)
31. For a ____________ sort, no matter how the data changes, the values will always stay in the sort order we kept stuff in.
답 : Manual
수동 정렬 사용하면 데이터가 어떻게 변경 되더라도 정의한 순서 유지
32. How does Tableau know at which level to aggregate values?
답 : Values are always aggregated at the level of granularity of the worksheet.
측정값을 뷰에 드래그 드롭하면? VLOD 수준에 맞게, 세분성 수준에 맞게 집계를 한다는 이야기!
이때, 집계 유형은 View의 context에 따라 달라진다!
33. Which of these is NOT a type of Quick Filter available in Tableau?
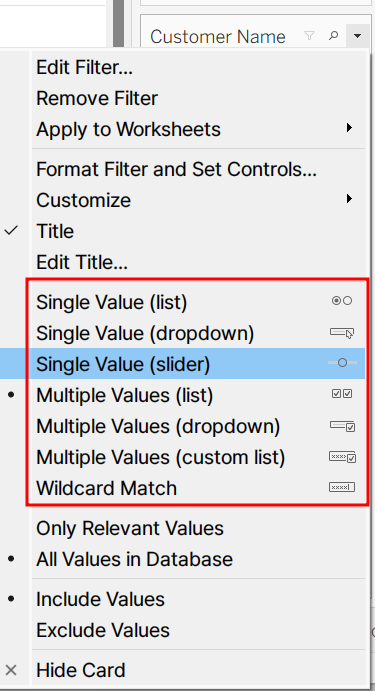
답 : Regex Match
필터 다룰 때 사용할 수 있는 옵션!
Regex Match는 없다~
34. ㅁHow can you format numbers in Tableau as currency?
답 : Right-click a measure or axis in the view and select Format. Then in the Format pane, click the Numbers drop-down menu.
View에서 측정값 또는 축 우클릭 - Format 선택 - Number에 drop-down menu에서 변경
35. Which of the following is a valid way to create Sets in Tableau?
답 : In the Data pane, right-click a dimension and select Create > Set.
집합에는 dynamic sets, fixed sets 두 가지가 있다!
dynamic sets : 한 개 차원으로만 설정 가능! 데이터 변경되면 같이 변경
36. Which of the following are valid ways to show Mark Labels in the visualisation?
답 :
Drag the measure to the Text label in the Marks Card - marks에 text label
Click on the Show mark labels icon in the Toolbar - toolbar에 mark labels icon
37. What is the following icon in the Data pane used to do?

요 녀석 역할은? 답 : View Data
38. Which of the following URL prefixes are permitted when creating a URL Action in Tableau?
답 : HTTPS HTTP, FTP
39. ________________ can only create header. _______________ will create header and axis both.
답 : Dimensions, Measures
40. Which of the following are correct ways to define a join in Tableau version 2020.3 and above?
답 :
Right-click a logical table and click on open to go to the Join/Union canvas in the physical layer and add joins or unions.
Double-click a logical table to go to the Join/Union canvas in the physical layer and add joins or unions.
2020.3 이상에서 JOIN 하는 두 가지 방법은
1. logical table에서 Table Double Click
2. logical table에서의 Table Right Click - Open 이다
41. Which of the following are valid ways to add Totals to a view?
답 :
Using the Analytics Pane
From the Analysis Tab in the Menu bar on top
Total을 추가하는 방법은?
1. 좌측 Analytics Pane 이용
2. 상단 메뉴 바에 Analysis 이용
# Data Pane, Marks shelf 에는 없음
42. When using the manage metadata option, we can create custom names for columns where _____________ is the original name of the column whereas _____________ is the custom name we created in Tableau.
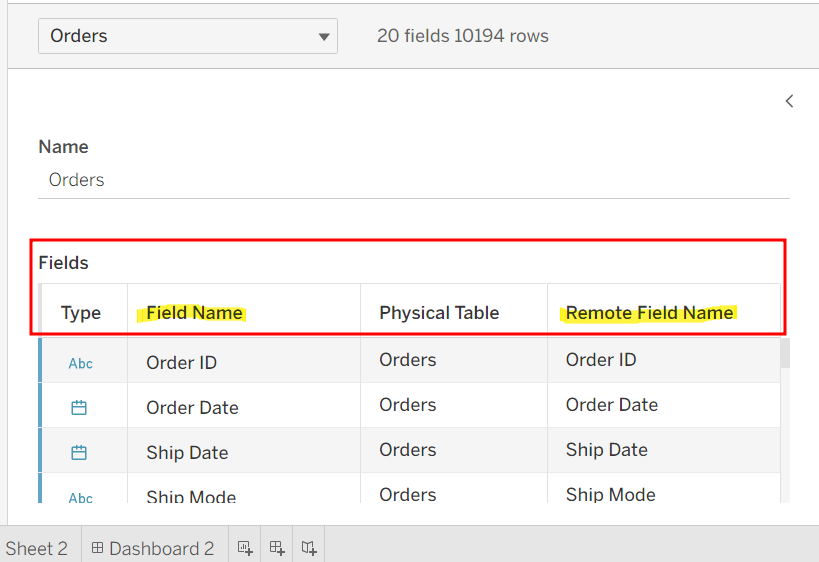
답 : Remote Field Name, Field Name
manage Metadata option 하면 우측 사진과 같이 데이터 영역을 생각하면 된다!
Field Name : 태블로에서 수정할 수 있는 사용자 지정 이름!
Remote Field Name : 원본 테이블 열 이름!
43. A ________________ is a single zip file that contains a workbook along with any supporting local file data and background images. This format is the best way to package your work for sharing with others who don’t have access to the original data.
답 : .twbx file (workbook, local file data, background images 전부 포함하는 단일 zip 파일 형식!)
twb와의 차이점? twb는 원본 데이터 자체가 들어있지 않고 연결 정보만 존재! =껍데기
44. Broadly speaking, after an importing a dataset in Tableau Desktop, all fields in it are broken down into _______________________
답 : Dimensions and Measures
데이터 세트 가져온 후 모든 필드는 차원과 측정값으로 분류!
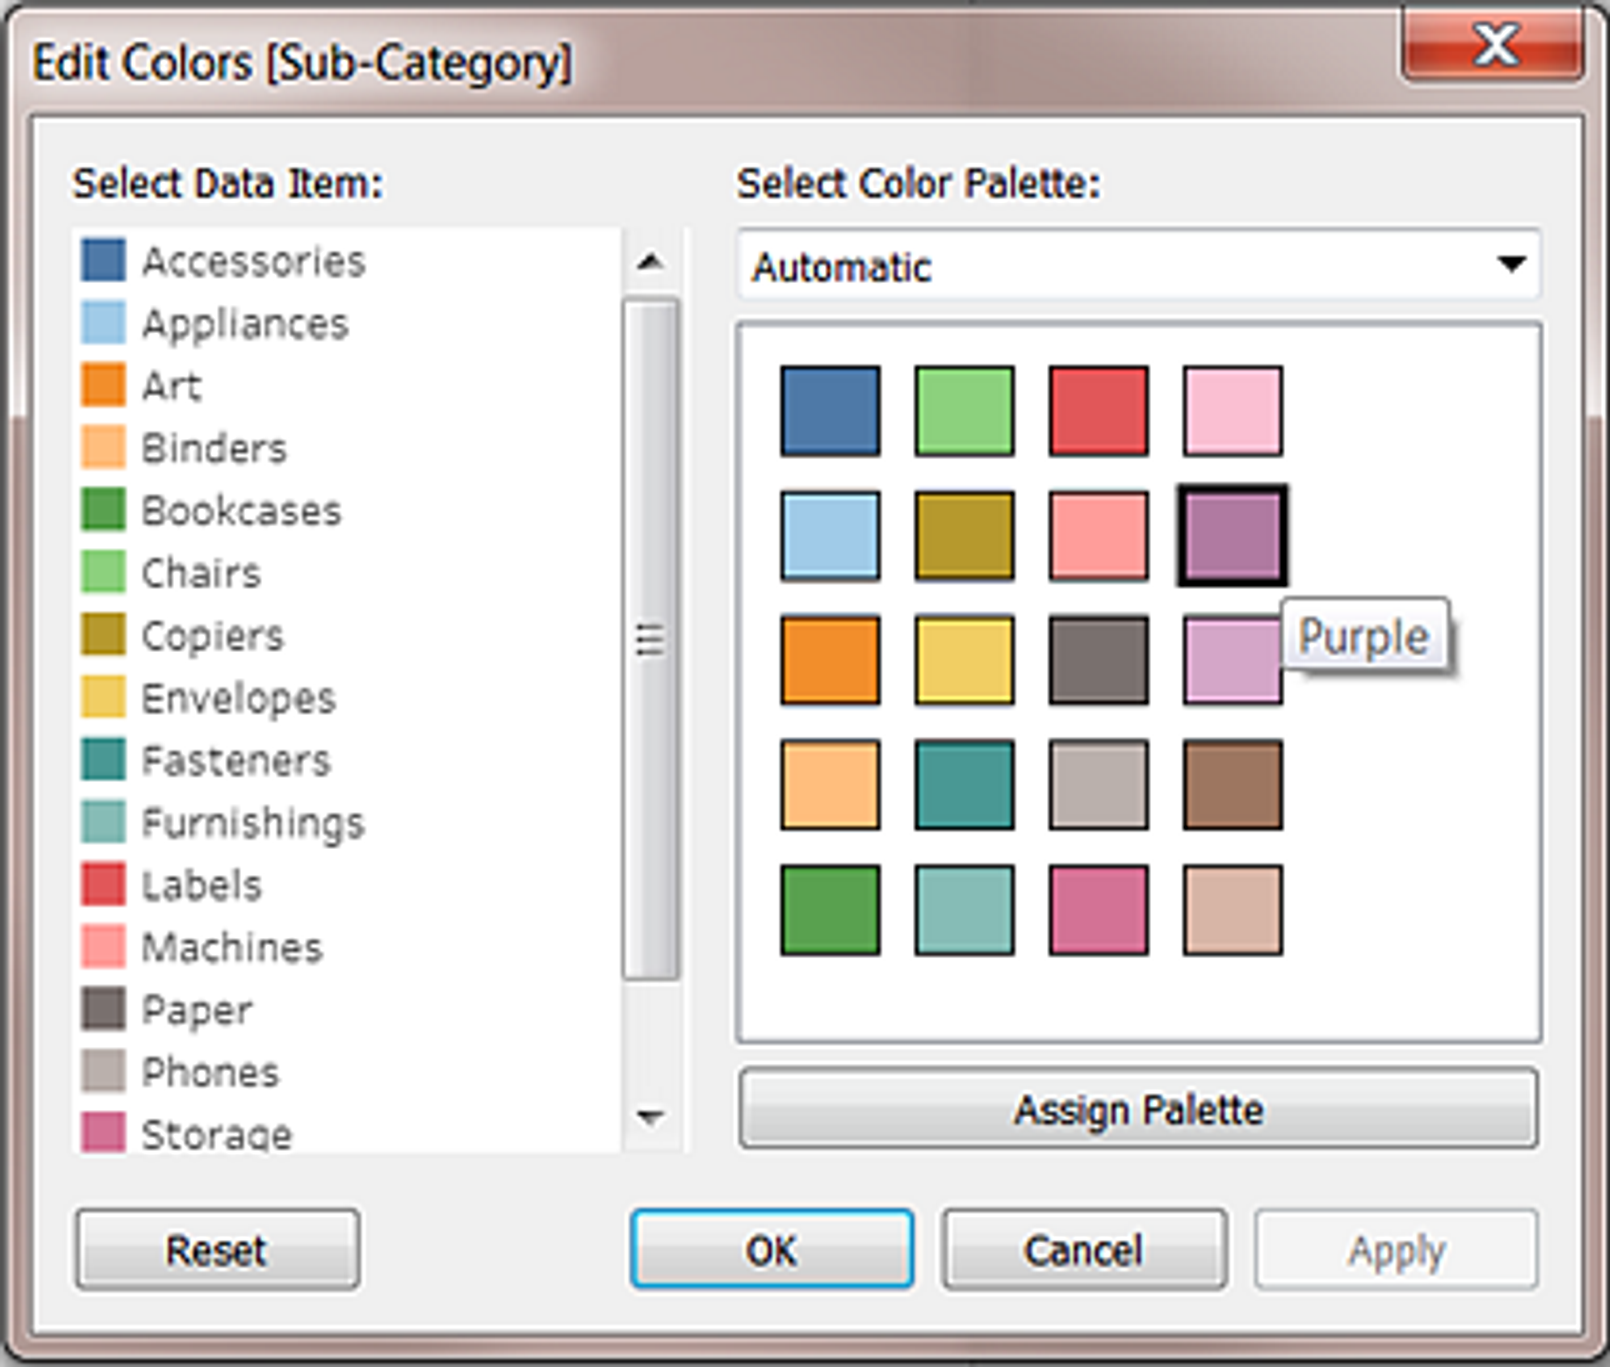
45. Dragging a ______________ to colour creates distinct colours for each item whereas dragging a ______________ to colour creates a gradient
답 : Discrete value, Continuous Value
불연속형은 고유한 색상이, 연속형은 그라데이션으로 만들어진다!
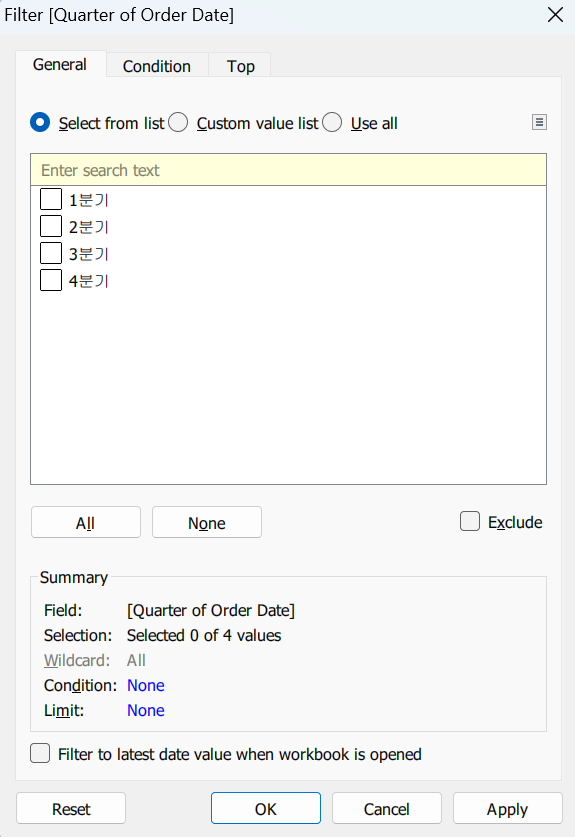
46. If you see the following Filter, then you're working with _______________________

답 : Date Values!
날짜 값이 불연속-연속인지에 따라 필터가 다르게 나타난다~

47. _________________ is useful when you need to change how the data source is configured on a sheet-by-sheet basis, and when you want to combine databases that don’t allow relationships or joins
답 : Data Blending
1. 시트 별로 데이터가 다르게 구성되었으면 할 때
2. relationship과 join을 허용하지 않는 데이터 베이스 형식을 결합하고 싶을
사용할 수 있는 결합 방식은?
48. Which of the following are valid ways of Grouping Data?
Using Labels in the View - View에서 직접 label 다중 선택
49. You may create a context filter to:
답 : Improve performance, Create a dependent numerical or top N filter
50. How can you change the default Tableau repository location?
답 : By clicking on File -> Repository Location and choosing a new location
51. ________________ files are shortcuts for quickly connecting to the original data that you use often. Data source files do not contain the actual data but rather the information necessary to connect to the actual data as well as any modifications you've made on top of the actual data such as changing default properties, creating calculated fields, adding groups, and so on.
답 : .tds
데이터 원본 파일 확장자! 자주 사용하는 원본 데이터에 빠르게 연갈하기 위한 바로 가기이다
52. Which of the following are valid ways to copy a worksheet visualisation as an image?
답 :
1-By clicking on Worksheet in the Tableau Main Menu above, and choosing Copy->Image
두 가지 방법 존재! 시트 우 클릭 - 복사 - 이미지
메뉴 바에 워크시트 - 복사 - 이미
53. How can you change the Default Aggregation for a measure in Tableau?
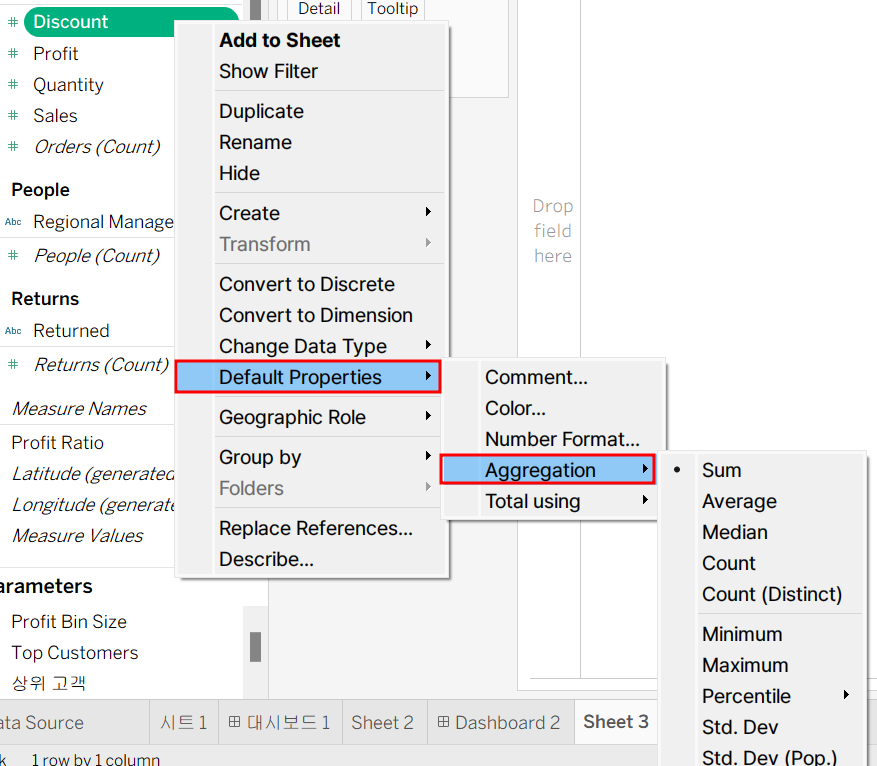
답 : By right clicking the measure -> Default properties and choosing Aggregation
태블로에서 측정값 기본 집계 형태를 변경하는 방법?
측정값 우클릭 - 집계 선택
💪🏻 좋았던 점, 앞으로 개선해야 할 점 (추가로 배워야 할 점)
📌 아직 헷갈리는 개념들이 많다! 전부 이해하고 암기하기~~
#유데미, #유데미코리아, #유데미부트캠프, #취업부트캠프, #부트캠프후기, #스타터스부트캠프, #데이터시각화 #데이터분석 #태블로
'STARTERS 4기 🚉 > TIL 👶🏻' 카테고리의 다른 글
| [STARTERS 4기 TIL] SQL 심화 #1 - 데이터 파악 (230410) (0) | 2023.04.10 |
|---|---|
| [STARTERS 4기 TIL] 프로젝트 기반 태블로 실전 트레이닝 #20 - 태블로 자격증 공부 #3 (230407) (0) | 2023.04.08 |
| [STARTERS 4기 TIL] 프로젝트 기반 태블로 실전 트레이닝 #18 - 자격증 공부 #1 (230405) (0) | 2023.04.08 |
| [STARTERS 4기 TIL] 프로젝트 기반 태블로 실전 트레이닝 #17 - 미니 해커톤 발표 및 자격증 공부 (230404) (0) | 2023.04.04 |
| [STARTERS 4기 TIL] 프로젝트 기반 태블로 실전 트레이닝 #16 - 미니 해커톤 3일차 (230403) (1) | 2023.04.04 |


