
ilovechoonsik
[STARTERS 4기 TIL] 프로젝트 기반 태블로 실전 트레이닝 #20 - 태블로 자격증 공부 #3 (230407) 본문
[STARTERS 4기 TIL] 프로젝트 기반 태블로 실전 트레이닝 #20 - 태블로 자격증 공부 #3 (230407)
춘시기좋아 2023. 4. 8. 18:29
📖 오늘 내가 배운 것
Tableau Desktop Specialist 공부 2
1. Tableau Desktop Specialist Test
1. True or False: Physical tables remain distinct (normalized), not merged in the data source whereas logical tables are merged into a single, flat table.
답 : False
2. Which of the following are true about dimensions?
답 :
They contain qualitative values (such as names, dates, or geographical data)
They affect the level of detail in the view
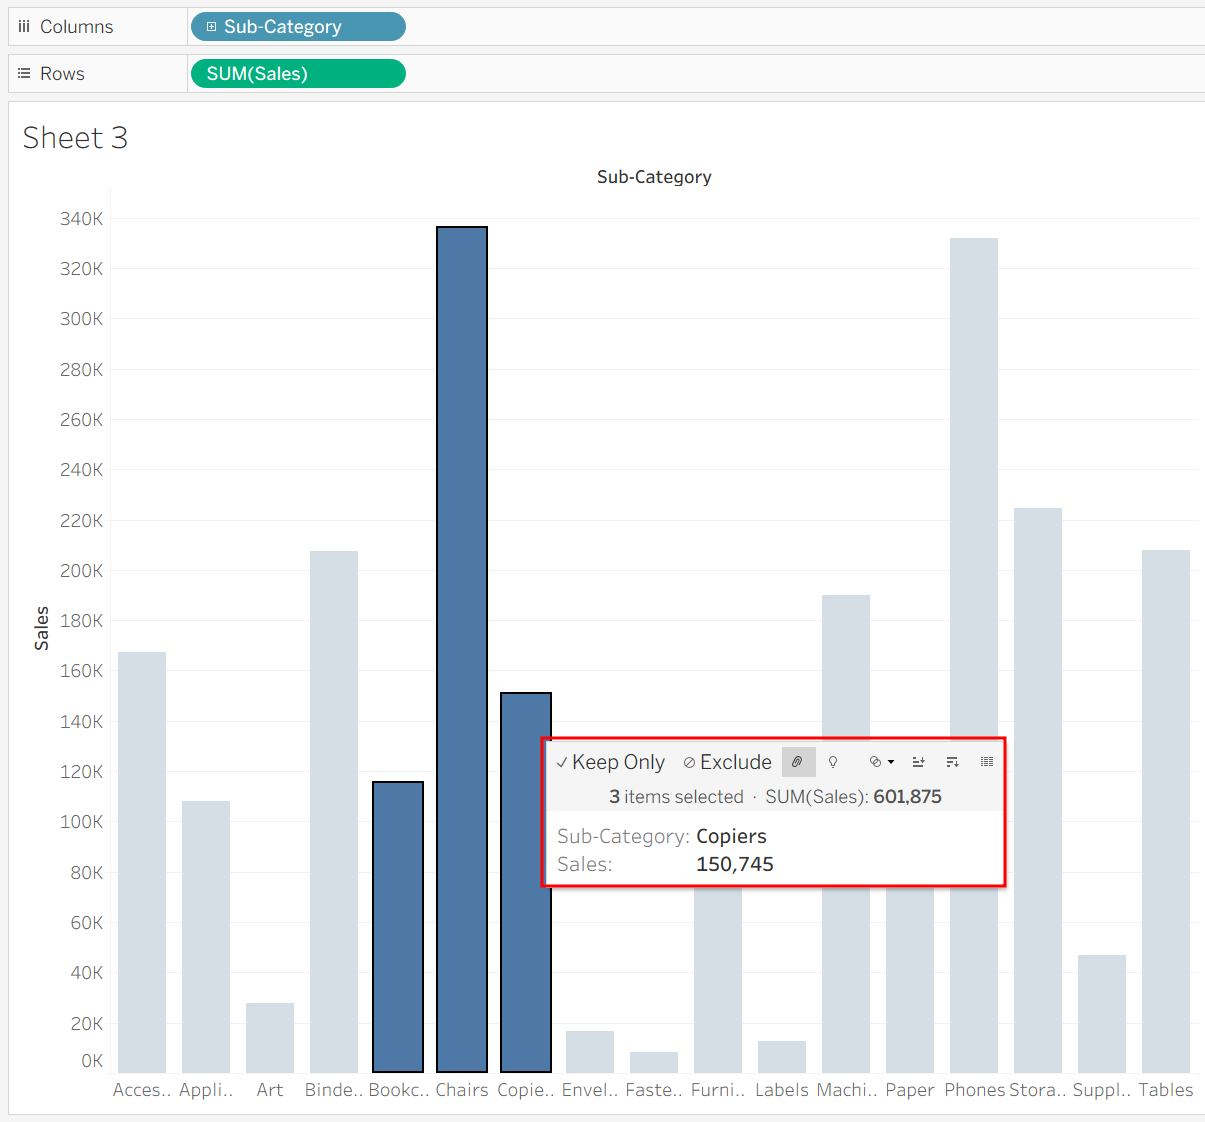
3. Suppose you have a bar chart. When we group by labels in a view, which of the following happens?
답 : A new mark (bar) is created, which consolidates all members of the group.
1-레이블 선택하고 그룹핑하면 한 개의 통합적인 막대가 생성된다!
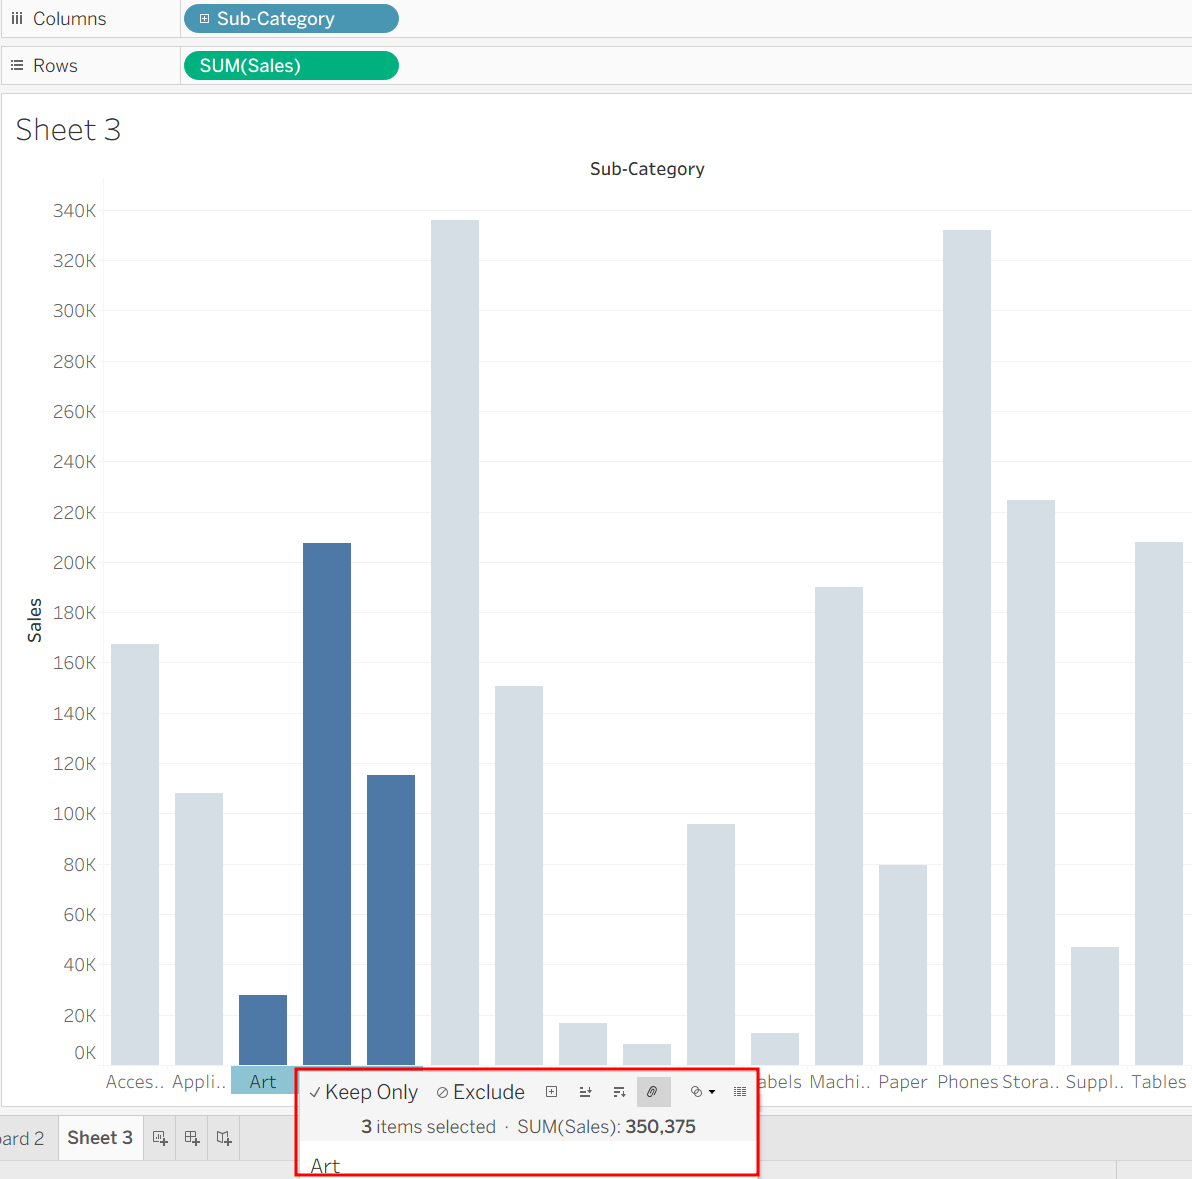

2-마크(바)를 선택하고 그룹핑하면? 해당 영역이 색상으로 강조된다

4. Which of the following are valid reasons to use a Tableau Data Extract (.tde) over Live Connections?
답 :
To support additional functionality such as count distinct
큰 데이터 이용해 작업할 경우 작업 속도 빠르게 가능
더 나은 퍼포먼스
고유한 값들에 대한 COUNT 가능~
5. When there are both negative and positive values for a field, the default range of values will use two color ranges. This is known as a ______________ palette.
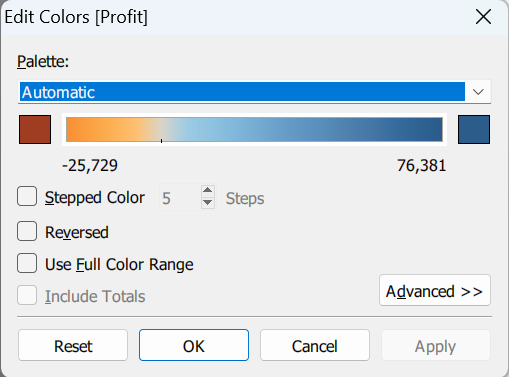
답 : diverging
필드에 음/양 값이 있고, 두 가지 색상 범위를 기본으로 사용!
요건? diverging palette
6. Suppose I have the following view. What will be the total number of marks if I drag a new measure to the row shelf vs the column shelf?

위와 같은 View에서 measure을 row, column에 던졌을 때의 marks는?
Row shelf : 1x4 = 4
Column shelf : 2x4 = 8


7. Which of the following sets would you use to compare the members?
답 : Combined Sets
집합 두 개 결합한 집합!
compare the members 나오면 대부분 Combined Sets!
8. What is a story point in Tableau?
답 : A single worksheet or dashboard
9. Which of the following describes the best way to change the formatting at a workbook level?
답 : Choose Format from the menu on top and then specify the formatting in the new Format workbook pane.
workbook level이기 때문에 통합 문서에 대한 서식 변경이 가능해야 한다~
요걸 하려면 상단 Menu bar에 Format - Workbook 들어가줘야 한다!
10. In which of the following scenarios would having a live connection be more beneficial than using an extract?
답 :
Analyzing and tracking real time flight updates
Analyzing real time data from production systems
Analyzing real time stock prices
live 이기 때문에 실시간 키워드가 들어간 것들을 선택하면 된다!
11. Which of the following are valid ways to make the font more readable in Tableau?
답 :
Make the Font color sharper / darker than the background
Increase the font size
Use a clear and readable font
백 그라운드가 어두우면 어떻게 하지~? 그냥 그러려니 하자
12. Is it possible to make a Measure discrete?
답 : Yes
불연속형 측정값을 만드는 게 가능?
가능! col, row shelf에 넣으면 모든 측정값이 text로써 VLOD를 세분화한다
13. When field names in the Union do not match, then:
답 : Both field names are present in the Union, but contain several null values
21. Beginning in version 10.5, when you create a new extract, it uses the _________ format instead of the .tde format.
답 : .hyper
10.5 버전 이후 부터 tde의 업그레이드 버전인 hyper가 나타났다!
22. If you are working with a huge dataset, which of the following are strong reasons to use a context filter?
답 :
To include only the data of interest
Improve query performance
큰 데이터 사용할 때 context filter의 이점?
1-쿼리 퍼포먼스 증가 (젤 앞 단에서 콘택스트 필터로 먼저 다 거르고 쿼리 쏘기 때문에 빠르다)
2-내가 보고 싶은 것만 젤 앞 단에 가져와서 본다
23. Which of the following are true about Dashboards in Tableau?
답 :
Tiled items don't overlap
A bar chart can be used a floating item
Floating items can be layered over other objects
부동이 아니라면 타일은 겹치지 않는다
차트들 부동으로 놓을 수 있다!
부동은 겹치기 가능
24. While borders and background colors let you visually highlight items on a dashboard, _________ lets you precisely space items.
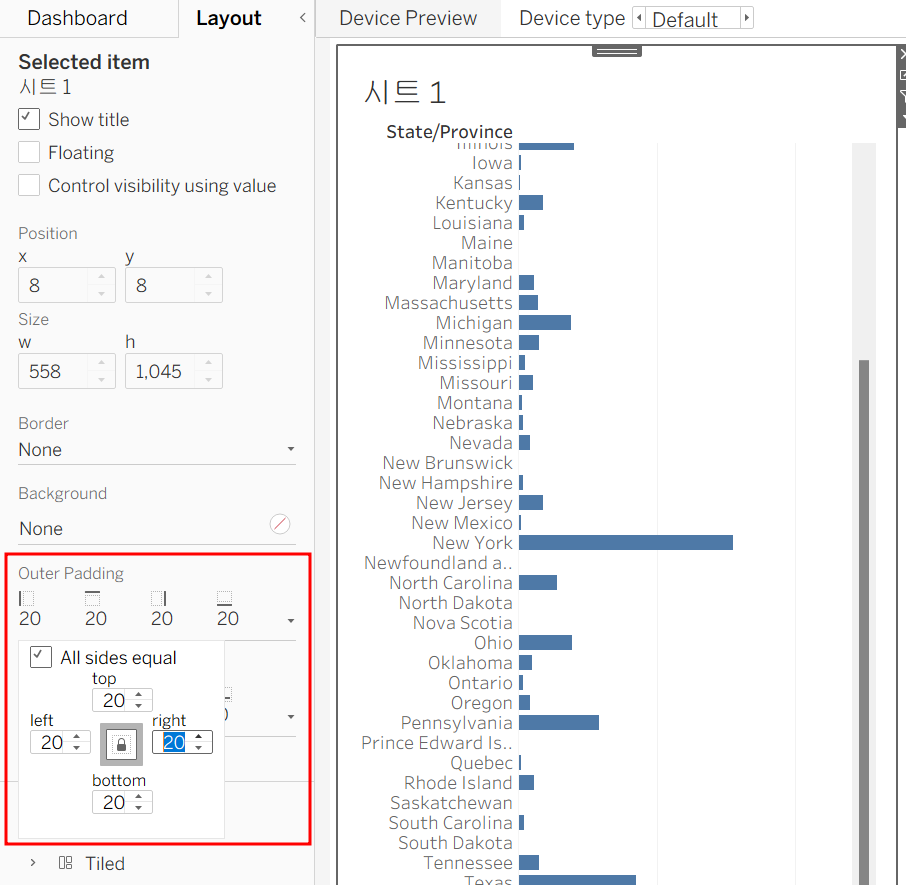
답 : padding
대시보드 항목들의 간격을 조절할 수 있다!
25. Which of the following calculations DO NOT need a quick table calculation?
답
Standard Deviation
Rank
Moving Average
Variance
표준 편차와 분산은 집계 유형에서도 변경할 수 있다!
근데 Rank와 Moving Average는?
계산된 필드 쓰지 않는 이상 퀵 테이블 계산으로만 구할 수 있다.
26. Which of the following are valid ways to italicize Tooltip content in Tableau?
Click on Format in the Menu bar, choose Font, and then edit the Tooltip options to italicize the font
Click on Tooltip in the Marks card, select the text, and then use the Italics option
Click on Worksheet in the Menu bar, select Tooltip, and then use the italics option
태블로에서 도구 설명을 기울임꼴로 변경하는 방법?
1-Menu bar의 Format, Font, edit Tooltip option
2-Makrs card의 Tooltip
3-Menu bar의 Worksheet, Tooltip
27. Which of the following lets you group related dashboard items together so you can quickly position them?
답 : Layout Containers
대시보드에서 레이아웃 컨테이너 사용하면 아이템들을 빠르게 배치할 수 있다~
28. If you see a Blue field, generally it will add _____________ to the view
답 : headers
파랑이를 본다면? 고 녀석은 View에 headers를 추가한다!
왜? 파랑이 = discrete
29. Which of the following are valid way(s) to make either of Rows or Columns Bold without affecting the other?
답 :
Choose Format from the Menu bar, select Row or Column, and then select Bold under the header option
Right click on Rows or Columns, and choose format. In the Font option click on Bold
31. Which of the following charts types always includes bars sorted in descending order?
답 : Pareto Chart

33. We can use ______________ as a static tool to open and interact with packaged workbooks with extracted data sources that have been created in Tableau Desktop.
답 : Tableau Reader
정적인 도구로써, 원본 데이터가 있는 패키지 통합 문서를 열고 상호작용할 수 있는 녀석은? Tableau Reader
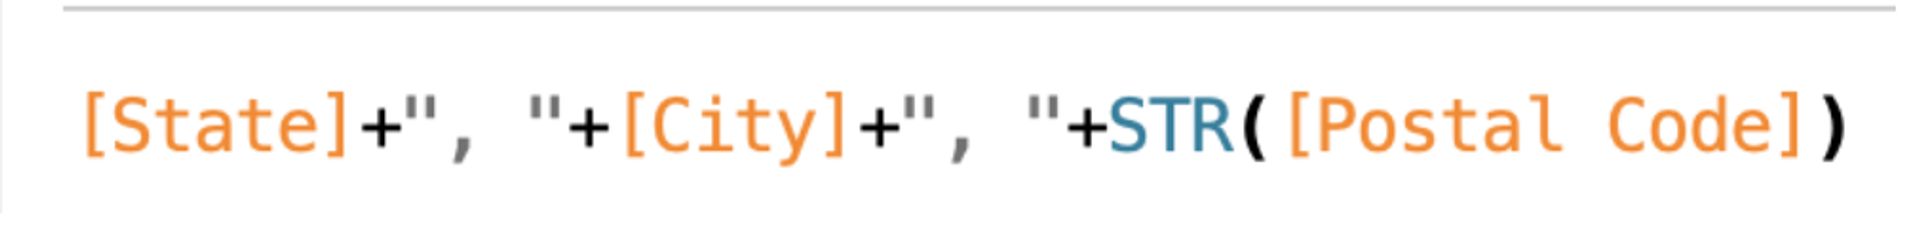
34. True or False: To concatenate fields, they must be of same data type
답 : True
35. Which of the following are the options to export the data used to build the view / visualisations?
답 : MS Access Database, CSV file
시각화에 사용한 데이터를 추출할 때 사용할 수 있는 옵션은?
Window = MDB
MAC = CSV
36. Which of the following are valid ways to trigger actions for a Dashboard?
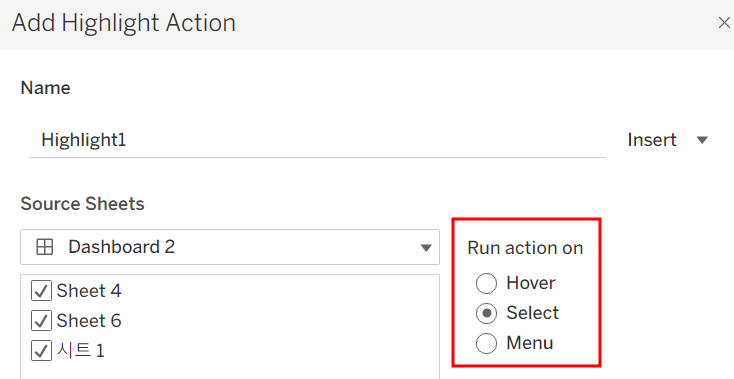
답 : Select, Menu, Hover
37. For a relative date filter, the default anchor is _________________
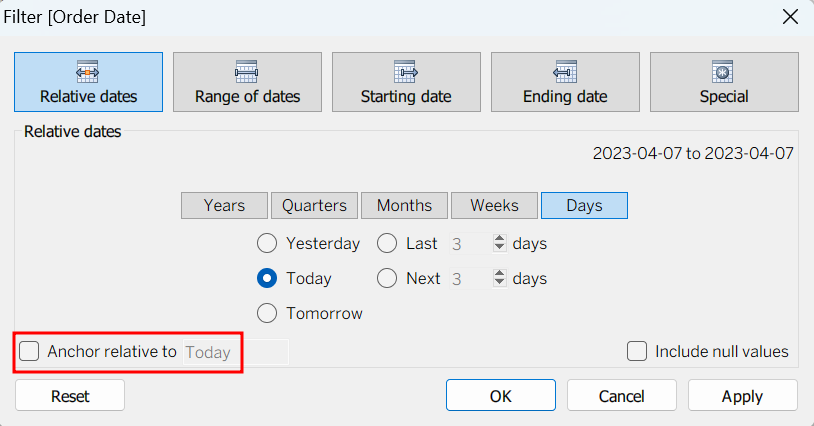
답 : Today's date
relative date filter 사용 시 anchor = today
38. The calculation [Ship Date] - [Order Date] will return _______________
답 : Number of days between these dates
태블로에서 날짜 - 날짜는? 일수 차이
39. True or False: Sets can be created on Measures
답 : False
Sets가 Measure로 만들어지는가? 불가능!
태블로에서 집합은 차원을 기반으로 만들어진다.
집합 걸 때, 조건으로 차원과 측정값 모두 줄 수 있지만 측정값으로 집합을 만드는 건 불가능
39. For creating variable sized bins we use __________________
답 : Calculated Fields
가변적인 크기의 구간 차원을 정의할 때 계산된 필드를 사용할 수 있음!
ex) age < 21 then under 21, < 32 then 21-32 처럼
40. True or False: A LEFT JOIN or INNER JOIN creates a row each time the join criteria is satisfied, which can result in duplicate rows. One way to avoid this is to use relationships instead.
답 : True
JOIN은 조건이 충족될 때마다 행을 생성하기 때문에 중복 문제가 발생할 수 있다! 고럴 때 사용하는 방법은 Relationships 이다~ 맞다! JOIN의 중복 문제와 특정 데이터 형식 지원 문제를 해결하기 위해 나온 게 Relationship
41. True or False: A reference line cannot be added from the Analytics Pane
답 : False
42. Is it possible to deploy a URL action on a dashboard object to open a Web Page within a dashboard rather than opening the system’s web browser?
답 : YES, we can do this with the help of a Web-Page object
대시보드에서 웹 페이지 여는 게 가능? -> 완전 가능
43. Which of the following are interactive elements that can be added to a dashboard for users?
답 :
Filter Action
Highlight Action
URL Action
대시보드에서 사용자가 상호작용 할 수 있도록 하는 기능? 필터, 하이라이트, URL
44. Which of the following is not a Trend Line Model?
답 : Binomial Trend Line
공식 Tableau 문서에 따르면 Tableau 5가지 유형의 추세선은 다음과 같다!
1) Linear Trend Line
2) Logarithmic Trend Line
3) Exponential Trend Line
4) Polynomial Trend Line
5) Power Model
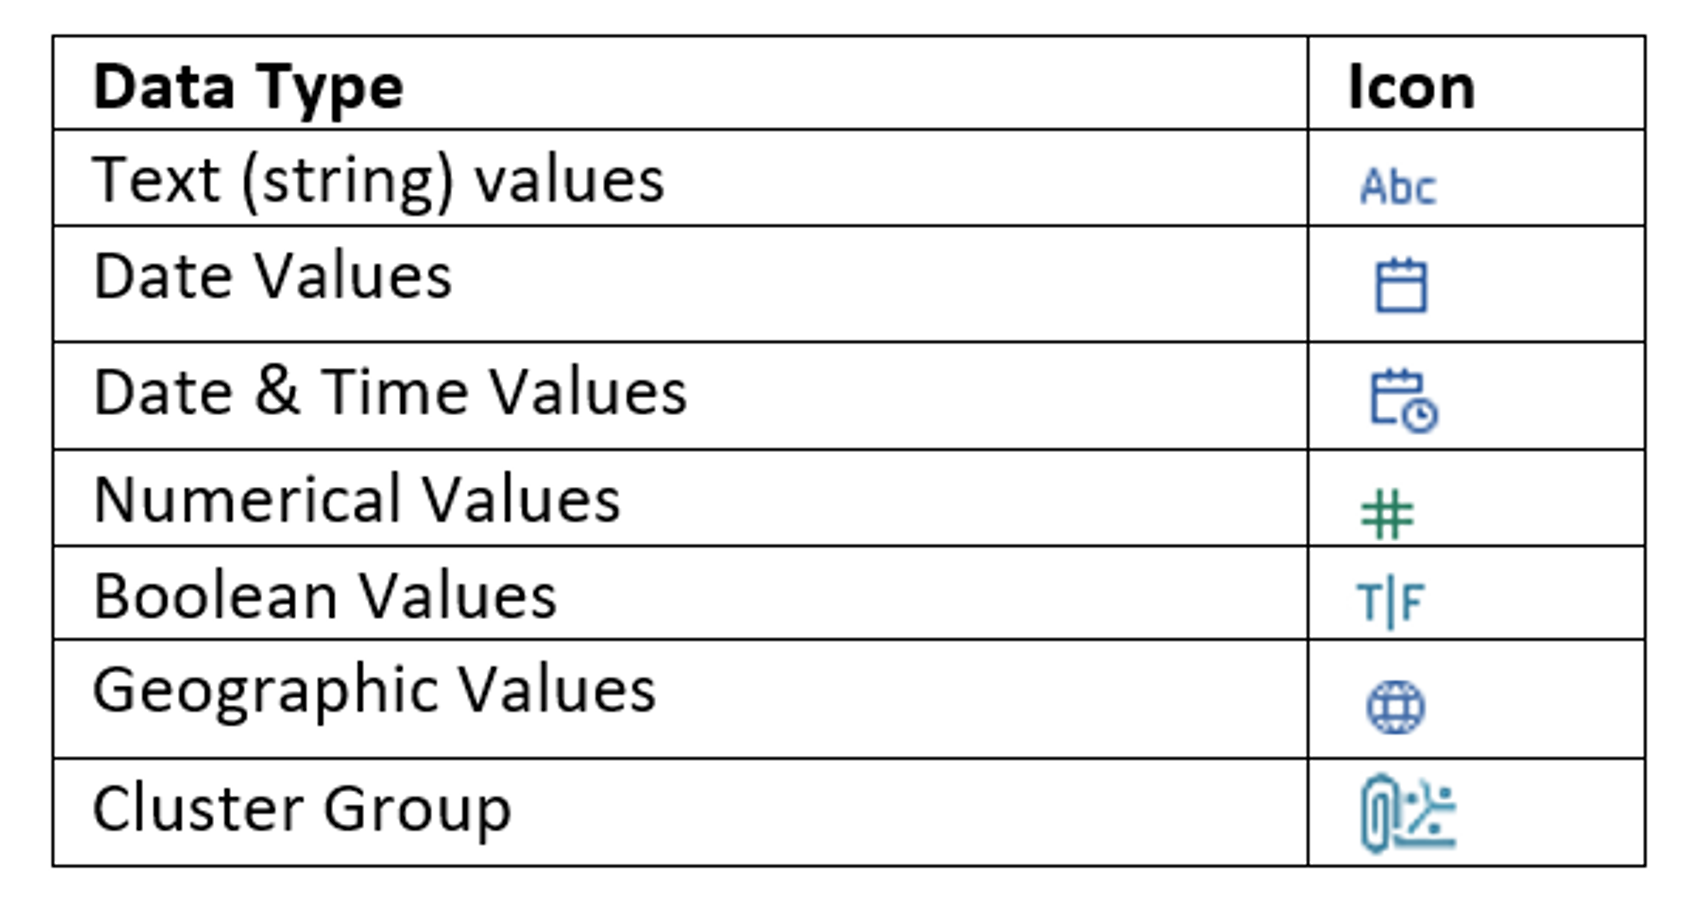
45. The icon associated with the field that has been grouped is a ______________
답 : Paper Clip
그룹은 클립 모양! 집합은 벤다이어그램! 데이터 타입에 따른 아이콘은? 아래와 같다
46. You can use the __________________ in Tableau to clean / organise your data.
답 : Data interpreter
데이터 해석기 사용해서 데이터를 정리할 수 있다!
47. Which of the following points are True about Viz Animations?
답 :
They can be turned on for certain worksheets only
Sequential animations take more time but make complex changes clearer by presenting them step-by-step
It is possible to turn them on for the entire workbook at once
애니메이션 기능에 대해 참인 내용!
Default Duration = 0.3
특정 워크시트에 대해서만 켤 수 있다!
전체 통합 문서에 대해 한번에 작동시킬 수 있다!
Sequential 애니메이션은 시간이 좀 걸리지만 단계 별로 표현할 수 있어 좋
48. Which of the following are True for Measure Names?
답 :
- When you add it to a view, all of the measure names appear as row or column headers in the view.
- When working with a text table showing Profit for each Category, when you add Sales to the text table (by dragging it and dropping it in the view), the measure names field is automatically dragged to the row and filter shelves.
- It contains the names of all measures in your data, collected into a single field with discrete values.
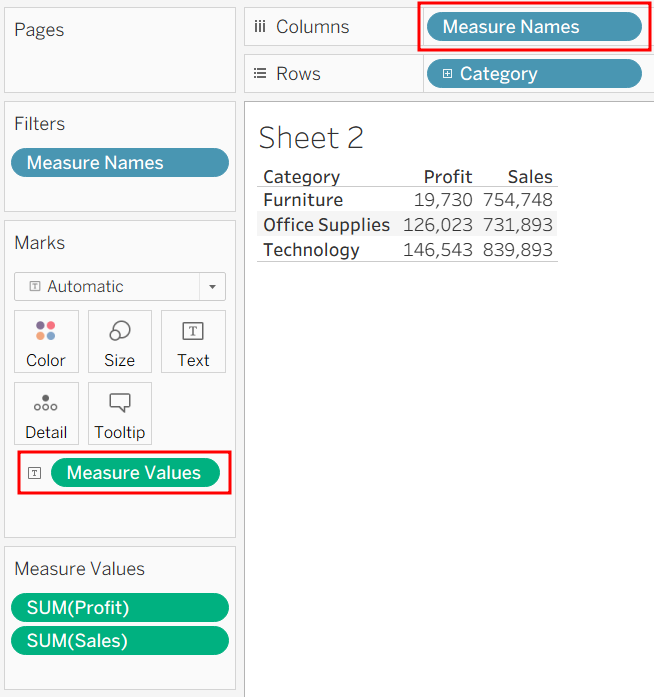
View Text Table에 드래그 드롭하면 사진과 같이
Measure name을 자동으로 추가한다!
49. To customize links based on the data in your dashboard, you can automatically enter field values as _______________ in URLs.
답 : parameters
대시보드 URL 기능에 데이터에 존재하는 값을 사용자가 전달할 수 있게 하려면?
당연히 parameters
50. __________ is a technique in Tableau which will identify marks with similar characteristics
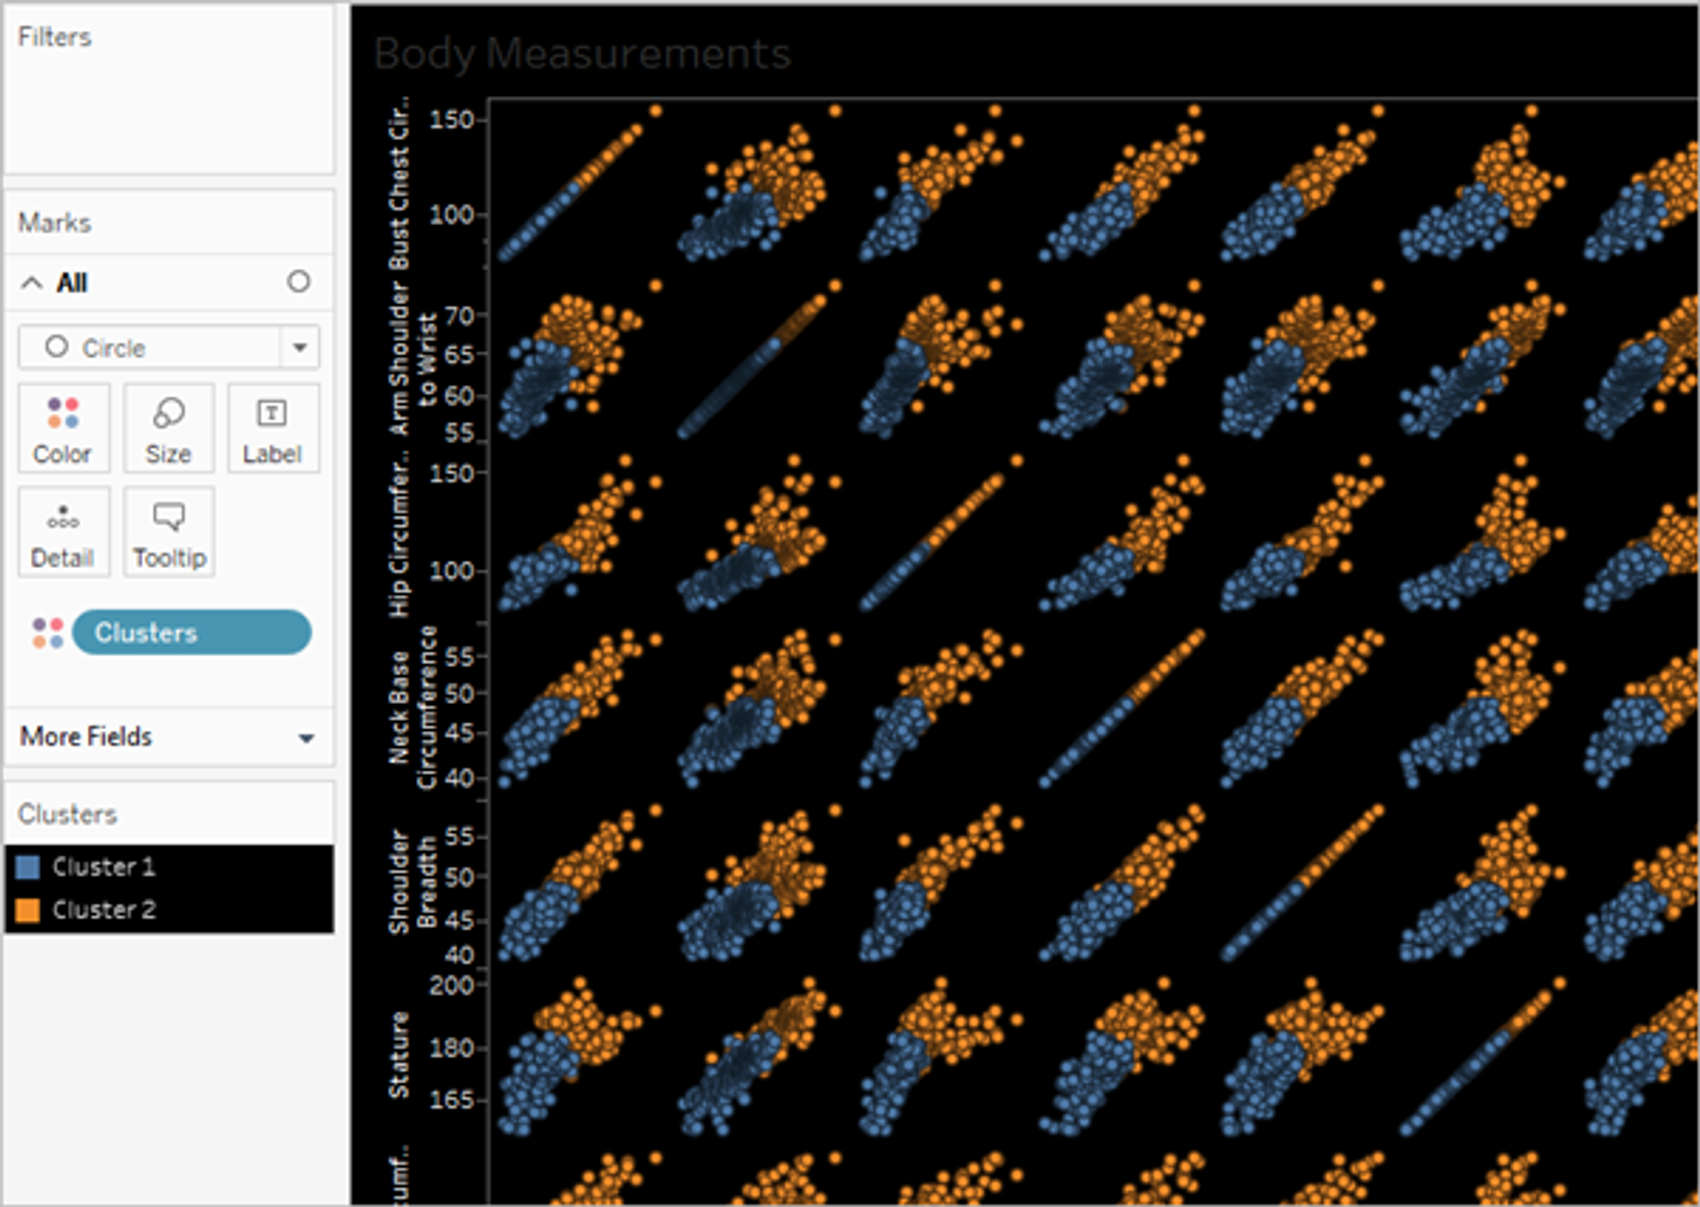
답 : Clustering
클러스터링? 하나의 데이터를 여러 개의 부분집합으로 분할하는 기법!
태블로에서 유사한 특성을 갖는 마크들끼리 부분집합 만드는 기법이라 한다, 수행 시 우측과 같은 느낌
51. To use a quick table calculation, which of the following programming languages do you need to know?
답 : None of these
계산된 필드를 만드는 거면 모르겠는데 퀵 테이블 계산은? 프로그래밍 언어를 알 필요가 없다!
52. Which of the following are valid use-cases for the 'Manage Metadata' functionality?
답 :
To see the table a field belongs to
To see the field name in the original data source
To view all hidden fields
오답 :
To clean and automatically fix the data issues in our data source
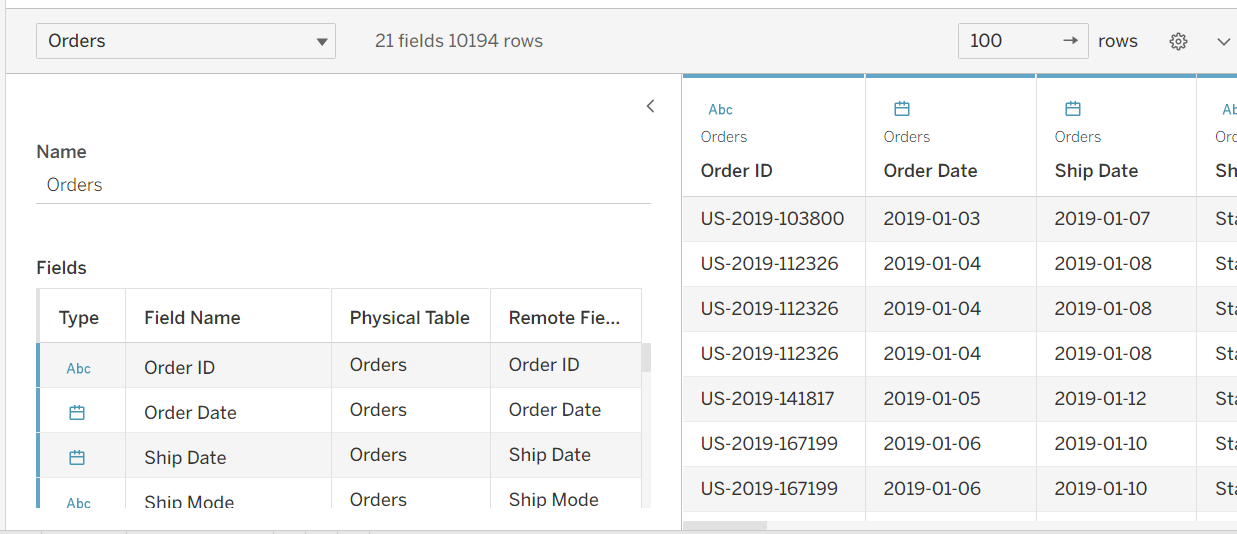
Manage Metadata = 데이터 원본에서 우측 사진에 해당하는 부분! 테이블에 대한 정보를 이것저것 확인할 수 있지만
데이터 문제를 정리하고 자동으로 수정하진 못한다
53. What does it imply if a field has a blue background?
답 : It is discrete
답이 왜 dimension이 아닌가~
measure도 dimension이 될 수 있고, dimension도 measure가 될 수 있기 때문이라 한다!
54. _____________ is a snapshot of the data that Tableau stores locally. Good for very large datasets of which we only need few fields.
답 : Tableau Data Extract (.tde)
tde는 데이터 저장형식!
tde - 큰 데이터 다루는데 용이, 빠르게 생성 가능, 퍼포먼스 향상, 함수 기능 제공, 오프라인 작업 수행 가능의 이점이 있다
55. True or False: Enabling any other type of sort (Field, alphabetic, or Nested) clears the manual sort we create.
답 : True
수동 정렬은 다른 정렬 시 지워진다!
56. Which of the following are FALSE about Joins?
답 :
Joins can be defined at the time of query dynamically
They are are a more dynamic way than relationships to combine data
57. _____________ contains the visualisations, info needed to build the visualisations, and a copy of the data source.
답 : Tableau Packaged Workbook (.twbx)
twb와의 차이는 데이터 원본의 포함 여부
58. You can create _______________ for members in a dimension so that their labels appear differently in the view.
답 : aliases
59. When working with Excel, text file data, JSON file, .pdf file data, you can use _________________ to union files across folders, and worksheets across workbooks. Search is scoped to the selected connection.
답 : Wildcard Search
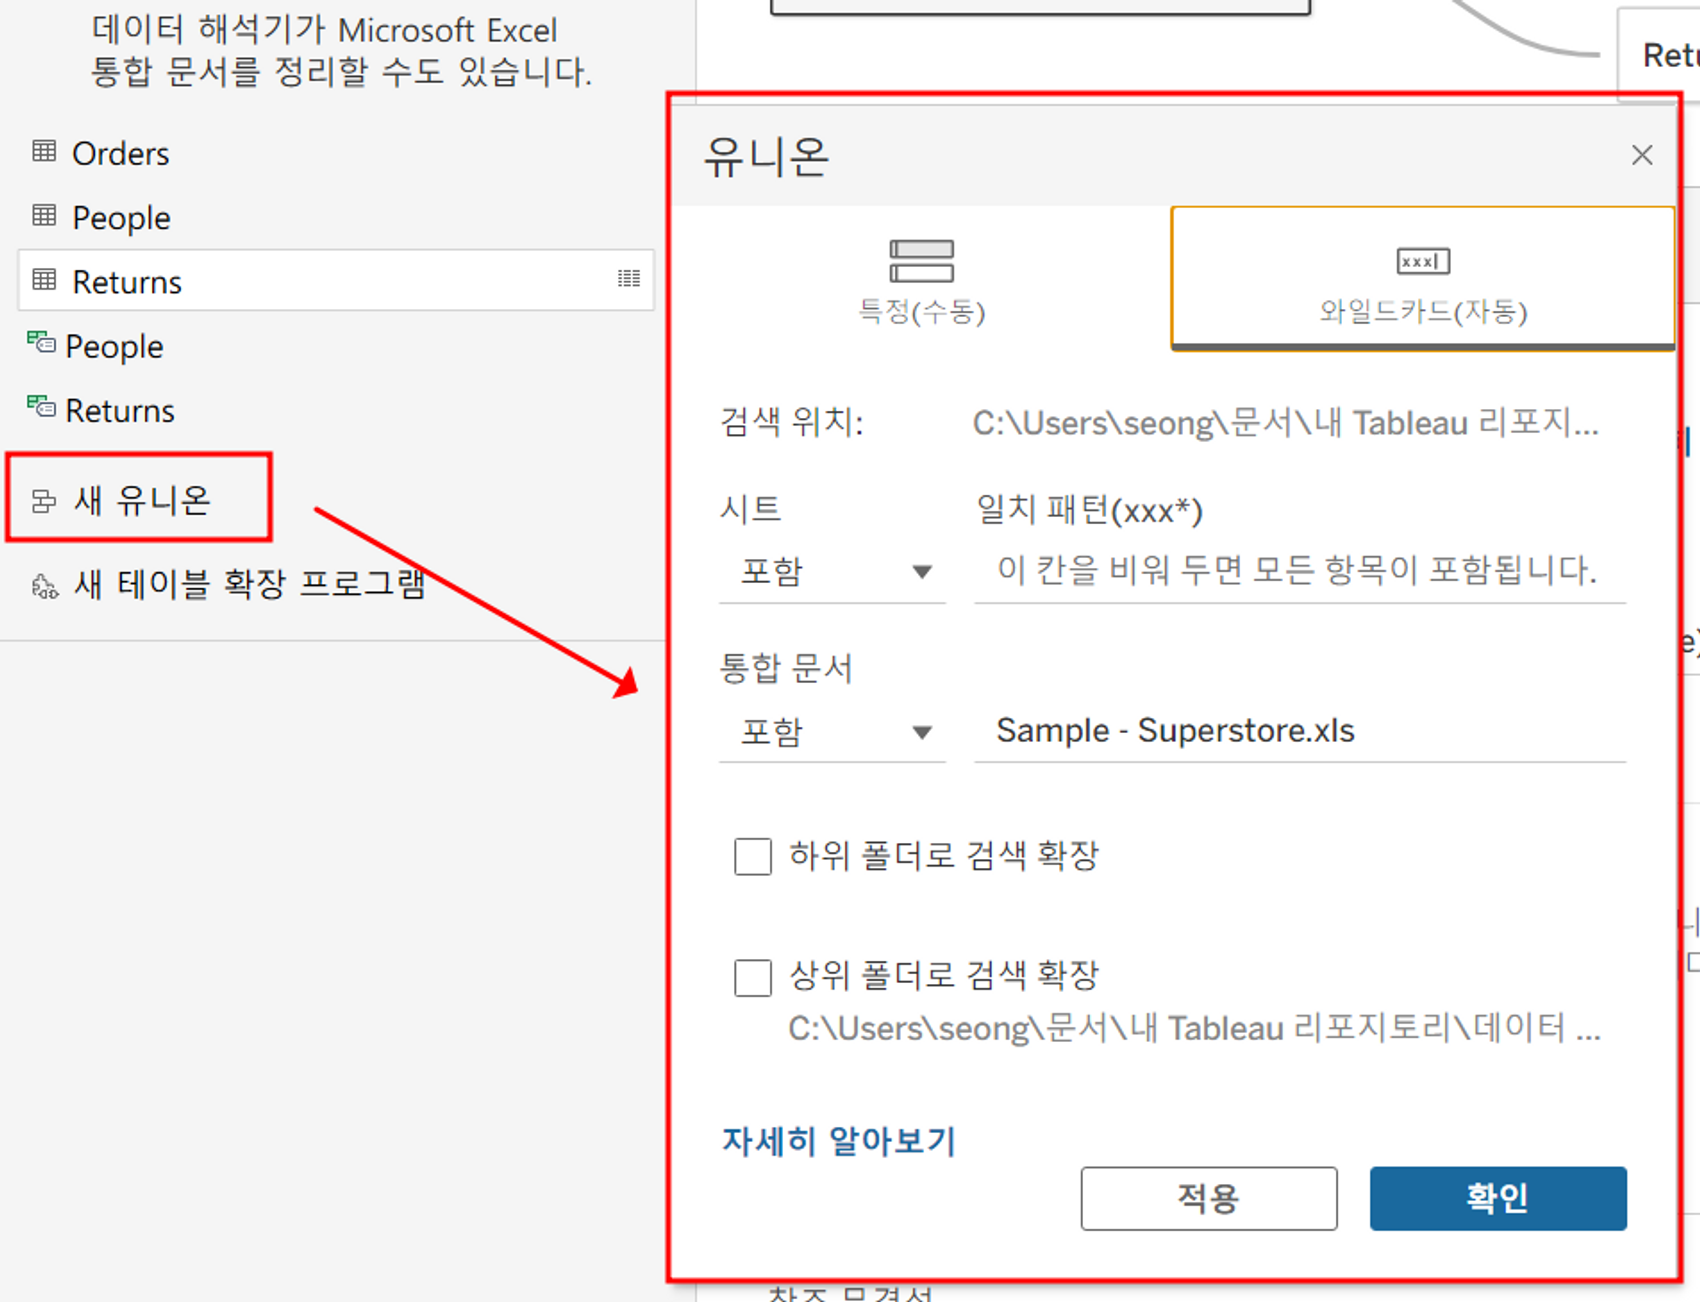
우측과 같이 Union 시 Wildcard Search 이용할 수 있다!
*를 사용해서 다양한 확장자 가진 녀석들 끼리 Union할 수 있게 해주는 거 같은데 써본 적이 없당60. True or False: When you drag additional tables to the logical layer canvas, Tableau automatically attempts to create the relationship based on existing key constraints and matching fields to define the relationship. If it can't determine the matching fields, then relating these tables is not possible.
답 : False
필드 매칭이 없더라도 일단 형성된다!
61. Which of the following are valid options to define the scope of a reference line? Choose 3.
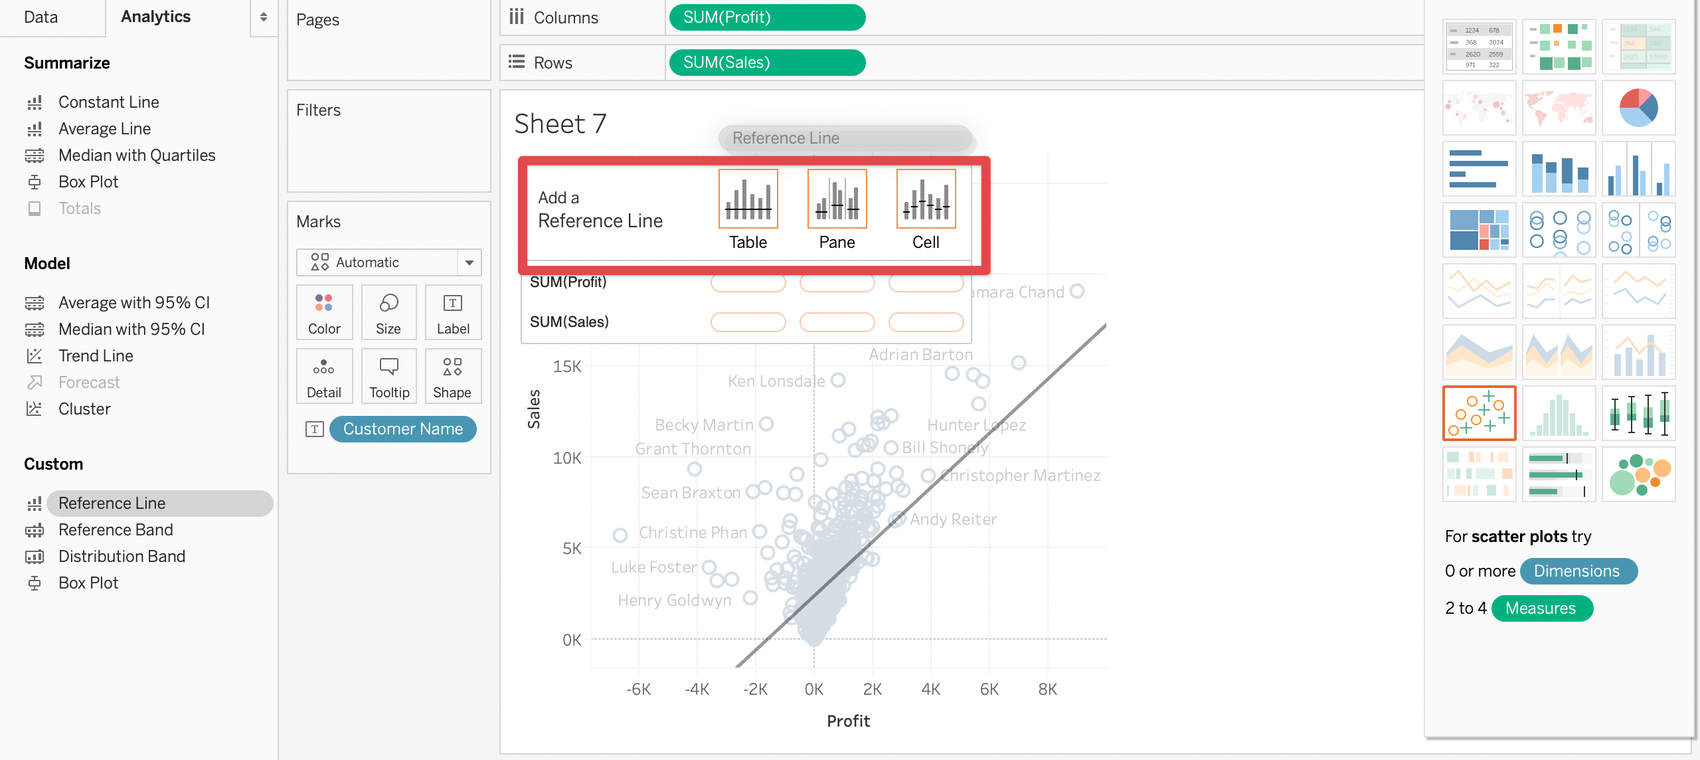
답 : Pane, Table, Cell
62. Which of the following are required to create a trend line?
답 : 2 measures on opposing axes, or a date and a measure on opposing axes.
추세선은 측정값-측정값 or 측정값-날짜 있어야 생성할 수 있다
63. Which of the following 2 fields CANNOT be deleted in Tableau?
답 : Measure Names, Measure Values
2. 조심조심 마지막 정리
📌 Test 1
1. 차원으로 bins 만들 수 있나? -> 가능! 근데 숫자로 이뤄진 차원이어야 함
2. measure을 row, column에 추가했을 때, axis가 쌓이는 방향은? row=y축에 measure 범위가 들어가며 세로 막대, column=x축에 measure 범위가 생성! 그에 따라 가로 막대 생성
3. stacked bar chart는 불연속 카테고리를 별도의 막대를 사용해서 시각화하지 않는다!
📌 Test 2
1. 토탈을 추가하는 방법? : 분석 패널, 메뉴 바의 분석
2. 마크 레이블 추가 방법? : 메뉴 바에 분석, 텍스트 라벨, 툴 바의 아이콘
3. 집합을 만드는 방법? : 데이터 패널 - 차원 우클릭
4. 태블로는 집계 수준을 어떻게 아냐? : 항상 워크 시트의 세분화 수준에 따른다
5. 필터 적용 순서는? : 추출 - 데이터 소스 - 콘택스트 - 차원 - 측정 -
6. 퀵 필터 종류는? : list, dropdown, slider, wildcard match
📌 Test 3
1. tooltip 옵션 조절은 어디서? : 메뉴 바의 format-font, marks card-tooltip, 워크 시트 우 클릭 - 서식, 메뉴 바의 worksheet - tooltip
2. 참조선 추가 가능한 녀석들? : numeric, date
3. 대시보드 이미지로 뽑는 방법? : 오직 한 가지! 메뉴 바 - 대시보드 - copy image
4. col or row 축 bold로 만드는 방법 : 메뉴 바 - 포맷 -row/col 선택 후 header option, 축 우클릭 - 포맷
5. 퀵테이블 계산 필요 없는 경우? : 분산, 표준편차 등 테이블에 기준 두고 계산하는 게 아니면!
6. 대시보드 사이즈 조절 옵션? : Fixed, Automatic, Rang-e
7. 그룹핑을 라벨로 할 경우, 마크로 할 경우의 차이? : 라벨로 하면 걔네 포함한 막대가 하나 생기고 마크로 하면 색상 강조
8. Union 시 필드 이름이 다른 경우에는? : 필드 그대로 생기고 null 값
9. axis 서식 조절은? : 축 우클릭 - 포맷 - 폰트 bold
10. 음-양 값 색상 주는 경우 : diverging 발산
📌 Test 4
1. 유사한 특성을 가진 marks를 식별하는데 유용한 기술은? : Clustering
2. trigger actions for a dashboard? : select, menu, hover
3. 수치값으로 집합을 만들 수 있나? : 불가능! 집합은 오직 차원으로만 만들 수 있다. 수치값은 집합에서 여러 조건 사용할 때 참조에 사용
4. Measure Name 특징 : View에 measure 두 개 드래그 드롭 시 자동으로 filter와 row에 추가, 모든 measure의 이름 포함, view에 추가하면 measure의 text로 header 생김
5. ABS - 절댓값, ZN - 틀리면 0 반환, FLOOR - 내림, CEILING -반올림
💪🏻 좋았던 점, 앞으로 개선해야 할 점 (추가로 배워야 할 점)
📌 주말에 시험에 응시하기 위해 최종적으로 복습하는 시간을 가졌다!
이론을 어느 정도 굳히고 갈 수 있는 시간이 주어졌다는 게 행복하고
점점 점수가 오르는 걸 보니 뿌듯하다!!
#유데미, #유데미코리아, #유데미부트캠프, #취업부트캠프, #부트캠프후기, #스타터스부트캠프, #데이터시각화 #데이터분석 #태블로
'STARTERS 4기 🚉 > TIL 👶🏻' 카테고리의 다른 글
| [STARTERS 4기 TIL] SQL 심화 #2 - 기초 복습, 매출 지표 분석 (230411) (0) | 2023.04.12 |
|---|---|
| [STARTERS 4기 TIL] SQL 심화 #1 - 데이터 파악 (230410) (0) | 2023.04.10 |
| [STARTERS 4기 TIL] 프로젝트 기반 태블로 실전 트레이닝 #19 - 태블로 자격증 공부 #2 (230406) (0) | 2023.04.08 |
| [STARTERS 4기 TIL] 프로젝트 기반 태블로 실전 트레이닝 #18 - 자격증 공부 #1 (230405) (0) | 2023.04.08 |
| [STARTERS 4기 TIL] 프로젝트 기반 태블로 실전 트레이닝 #17 - 미니 해커톤 발표 및 자격증 공부 (230404) (0) | 2023.04.04 |


